
International Women's Day 2022... by the numbers
 International Women's Day 2022... by the numbers (PDF, 1.85 MB)
Description: By the numbers - International Women's Day 2022
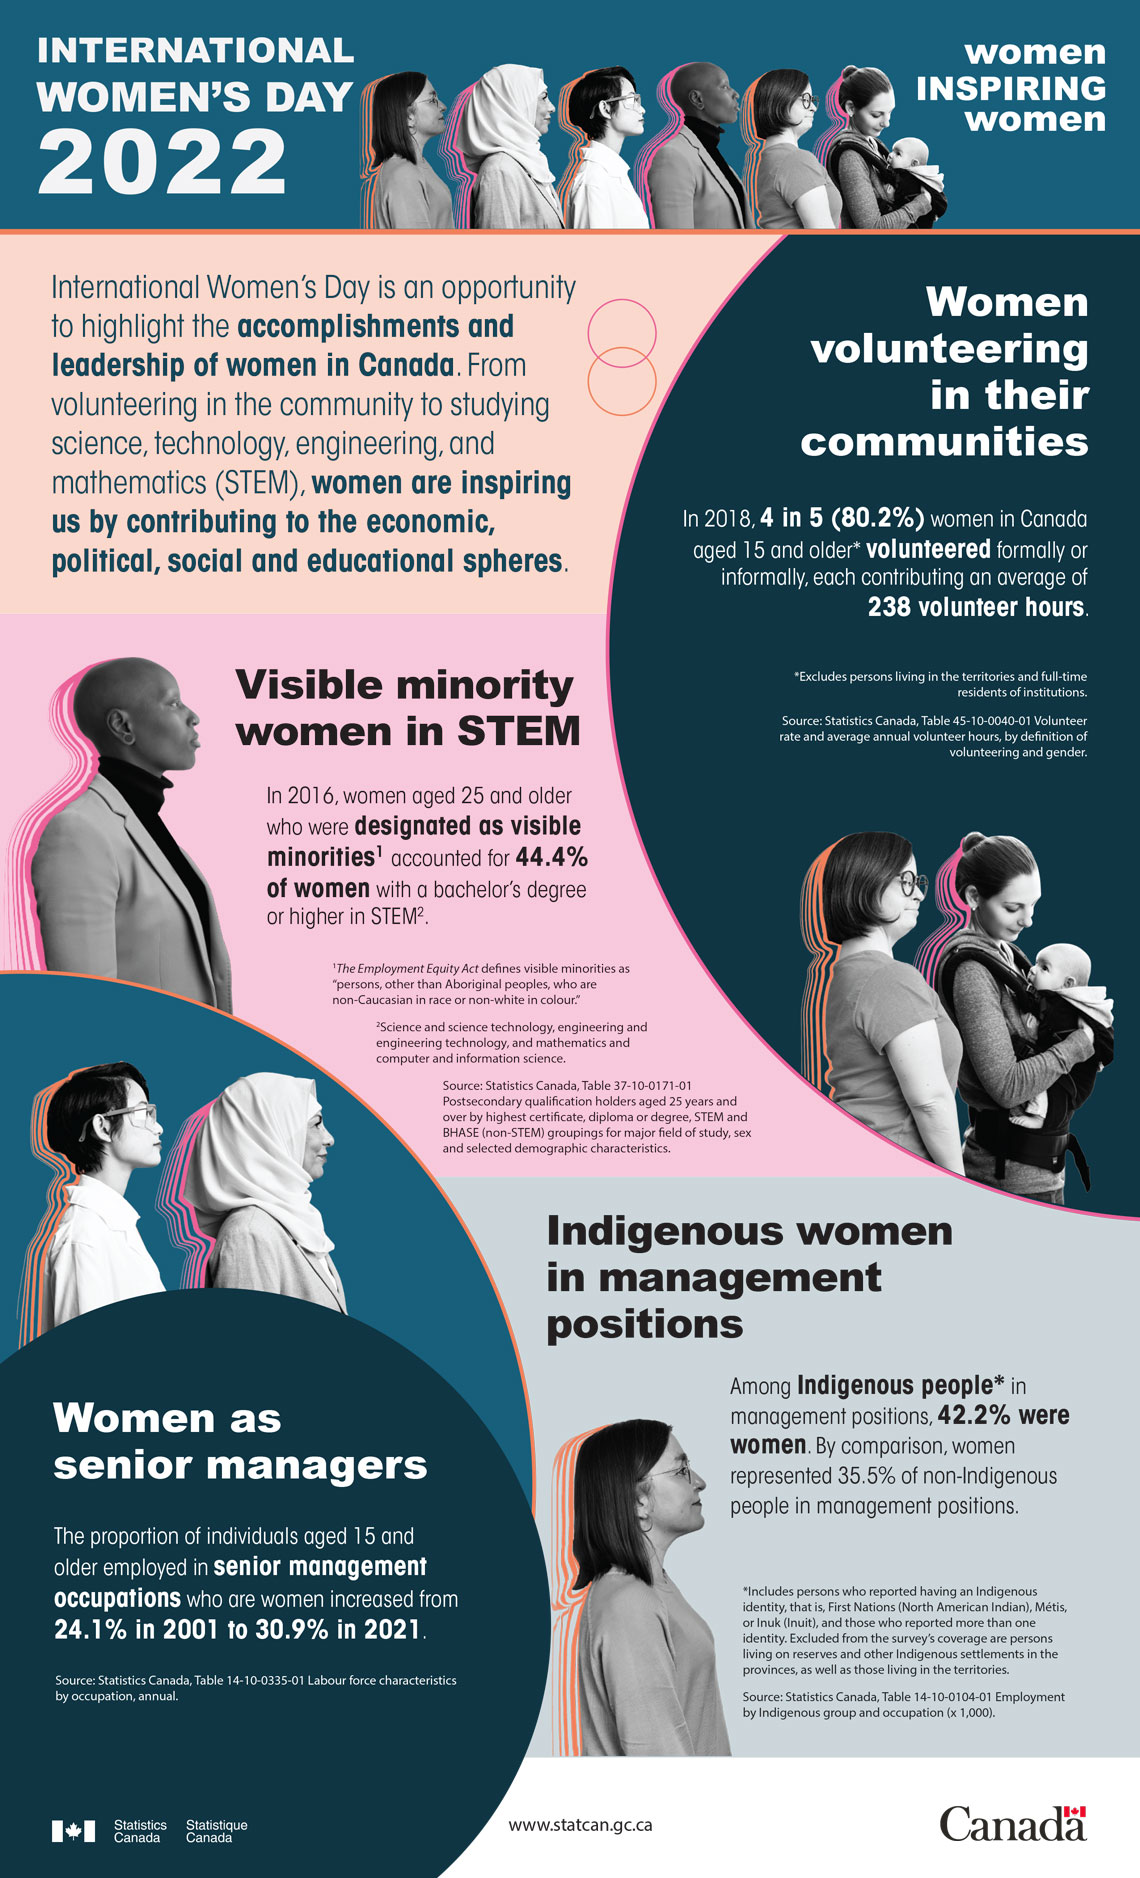
Women inspiring women
International Women's Day is an opportunity to highlight the accomplishments and leadership of women in Canada. From volunteering in the community to studying science, technology, engineering, and mathematics (STEM), women are inspiring us by contributing to the economic, political, social, and educational spheres.
Women volunteering in their communities
In 2018, 4 in 5 (80.2%) women in Canada aged 15 and older* volunteered formally or informally, each contributing an average of 238 volunteer hours.
Source: Statistics Canada, Table 45-10-0040-01 Volunteer rate and average annual volunteer hours, by definition of volunteering and gender.
Note: Excludes persons living in the territories and full-time residents of institutions.
Visible minority women in STEM
In 2016, women aged 25 and older who were designated as visible minorities* accounted for 44.4% of women with a bachelor's degree or higher in STEM*.
Source: Statistics Canada, Table 37-10-0171-01 Postsecondary qualification holders aged 25 years and over by highest certificate, diploma or degree, STEM and BHASE (non-STEM) groupings for major field of study, sex and selected demographic characteristics.
Note: The Employment Equity Act defines visible minorities as "persons, other than Aboriginal peoples, who are non-Caucasian in race or non-white in colour."
Note: Science and science technology, engineering and engineering technology, and mathematics and computer and information science.
Women as senior managers
The proportion of individuals aged 15 and older employed in senior management occupations who are women increased from 24.1% in 2001 to 30.9% in 2021.
Source: Statistics Canada, Table 14-10-0335-01 Labour force characteristics by occupation, annual.
Indigenous women in management positions
Among Indigenous people in management positions, 42.2% were women. By comparison, women represented 35.5% of non-Indigenous people in management positions.
Source: Statistics Canada, Table 14-10-0104-01 Employment by Indigenous group and occupation (x 1,000).
Note: Includes persons who reported having an Indigenous identity, that is, First Nations (North American Indian), Métis, or Inuk (Inuit), and those who reported more than one identity. Excluded from the survey's coverage are persons living on reserves and other Indigenous settlements in the provinces, as well as those living in the territories.
- Date modified: