
Disability Data Focus
Finding Disability and Intersectional Data using Statistics Canada's Gender, Diversity and Inclusion Statistics Hub
Overview
The Gender, Diversity and Inclusion Statistics Hub (GDIS Hub) is Statistics Canada's central platform for accessing gender, diversity and inclusion related data. The GDIS Hub serves as a key entry point to explore datasets, dashboards, and publications that include gender-disaggregated disability data and other intersectional data.
Together, these tools allow users to explore how disability intersects with gender, age, geography, income, education, and other identity and socio-economic factors to better understand differences in outcomes across groups.
This fact sheet focuses on:
- What disability data looks like in Canada
- How to access gender-disaggregated and intersectional disability data using the GDIS Hub
- How users can move from high-level indicators to detailed Statistics Canada data tables
- How other hubs, particularly the Accessibility statistics Hub, complement the GDIS Hub.
What Does Disability Data Look Like in Canada?
Statistics Canada collects disability data primarily through the Canadian Survey on Disability (CSD), which is the official source of disability rates in Canada. Other surveys, such as the General Social Survey - Caregiving and Care Receiving, and the Labour Force Survey (LFS), also include disability-related questions.
Disability data often includes:
- Disability status (with or without a disability)
- Disability characteristics, such as severity of disability and type of disability, (e.g., painrelated, hearing, mental health-related)
- Experiences of persons with disabilities, including labour market experiences, use of aids and assistive devices, and barriers to accessibility
- Intersectional characteristics, such as gender, age, education, income, Indigenous identity, immigration status and geography.
This allows users to move beyond a single-factor analysis, which further supports an intersectional Gender-based Analysis Plus (GBA Plus) approach, to examine how outcomes differ for women and men with disabilities, as well as across other characteristics.
Surveys such as the CSD and LFS use the Disability Screening Questions to identify persons with disabilities, while other surveys, such as the Canadian Social Survey (CSS), the Survey on Sexual Misconduct in the Canadian Armed Forces (SSMCAF) and the Public Service Employee Survey (PSES), rely on self-identification of disability. Population health surveys, including the Canadian Community Health Survey (CCHS) often include a measure of functional health, such as the Health Utilities Index (HUI) or the Washington Group (WG) on disability statistics. For more information on disability measurement, see the Technical Report on Disability Measurement in Canada.
Exploring Gender-Disaggregated Disability Data Through the GDIS Hub
The GDIS Hub connects users to dashboards, indicators, data tables, analytical reports and publications that include disability-disaggregated data.
Users can explore gender-disaggregated disability data, along with other population characteristics, to better understand differences in outcomes across groups. Using relevant data, including disaggregated data on various population groups, the Government of Canada can identify who may benefit unequally or may experience barriers to opportunities, supporting evidence-informed programs and policy decisions.
Using the GDIS Statistics Catalogue
The Gender, Diversity and Inclusion Statistics Catalogue is accessed by clicking the "Browse the GDIS catalogue" button on the GDIS Hub home page. This opens the searchable GDIS Catalogue, where you can enter keywords in the search bar to find related products in one place, including data tables, analytical articles, and infographics.
For example, searching 'employment and disability' returns a list of relevant Statistics Canada products, including data tables with disability disaggregated data, analytical articles, and an interactive dashboard. Disaggregated data breaks information down by population characteristics (e.g., disability status, gender, age, Indigenous Identity) to support intersectional analysis; see Statistics Canada's Disaggregated Data Action Plan for more.
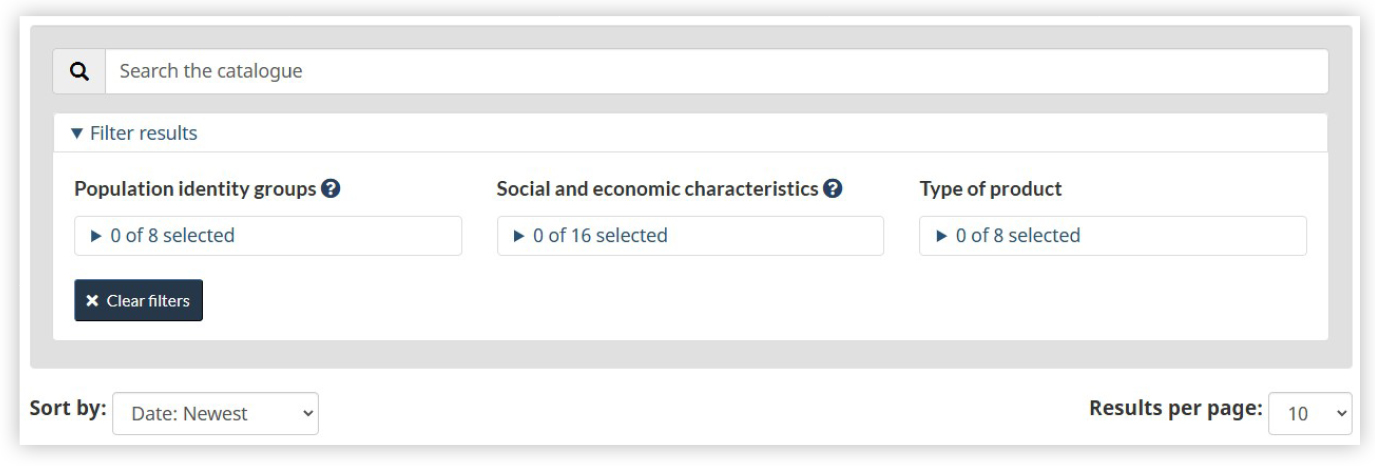
Figure 1 - A search interface
A search interface showing a search bar with the query “employment and disability” and filter options for Population identity groups, Social and economic characteristics, and Type of product, illustrating how users can refine results to access disaggregated data for intersectional analysis.
- Step 1 Search by keyword (e.g. employment and disability)
- Step 2 View related products (data tables, articles, dashboards, infographics)
- Step 3 Filter results - by population identity group (e.g. persons with disabilities)
- Step 4 Refine and customize data - select social and economic characteristics and type of product
Once results are displayed, users can refine them using the filters to narrow results by population identity groups (including persons with disabilities), social and economic characteristics, and type of product.
For example, selecting "Persons with disabilities" under Population identity groups limits results to products that include gender-disaggregated disability data. Results can then be further refined by social and economic characteristics and product type. This supports intersectional analysis across a wide range of subject areas and helps users quickly identify groups that may benefit unequally from programs or face barriers to opportunities. Such insights can also inform the development of evidence-based programs and policies.
For more detailed and customizable outputs, the Common Output Data Repository (CODR) provides the ability to combine multiple factors, enabling tailored data for research and program planning.
Case Study: Disability, Gender and Education
To illustrate intersectional analysis, the data table "Highest certificate, diploma or degree for persons with and without disabilities aged 15 years and over, by severity, by age group and gender" provides detailed data on education outcomes for persons with disabilities. The Customize table (Add/Remove data), allows users to disaggregate by:
- Geography
- Age group
- Gender
- Disability status and severity
- Highest certificate, diploma or degree
- Estimates
- Reference period
Example
To find the proportion of women with disabilities aged 25 to 64 years in Ontario who completed a university degree at the bachelor level or above in 2022, users can select the relevant options under Add/Remove data and click "Apply". The table then displays the percentage of women by level of educational attainment. All selected characteristics are displayed in the table, allowing users to clearly see the dimensions applied to the data.
For example, the table shows that 29.1% of women with disabilities aged 25 to 64 years of age in Ontario had completed a bachelor's degree or higher. This information can help identify gaps in educational outcomes and support evidence-informed program development targeting women with disabilities.
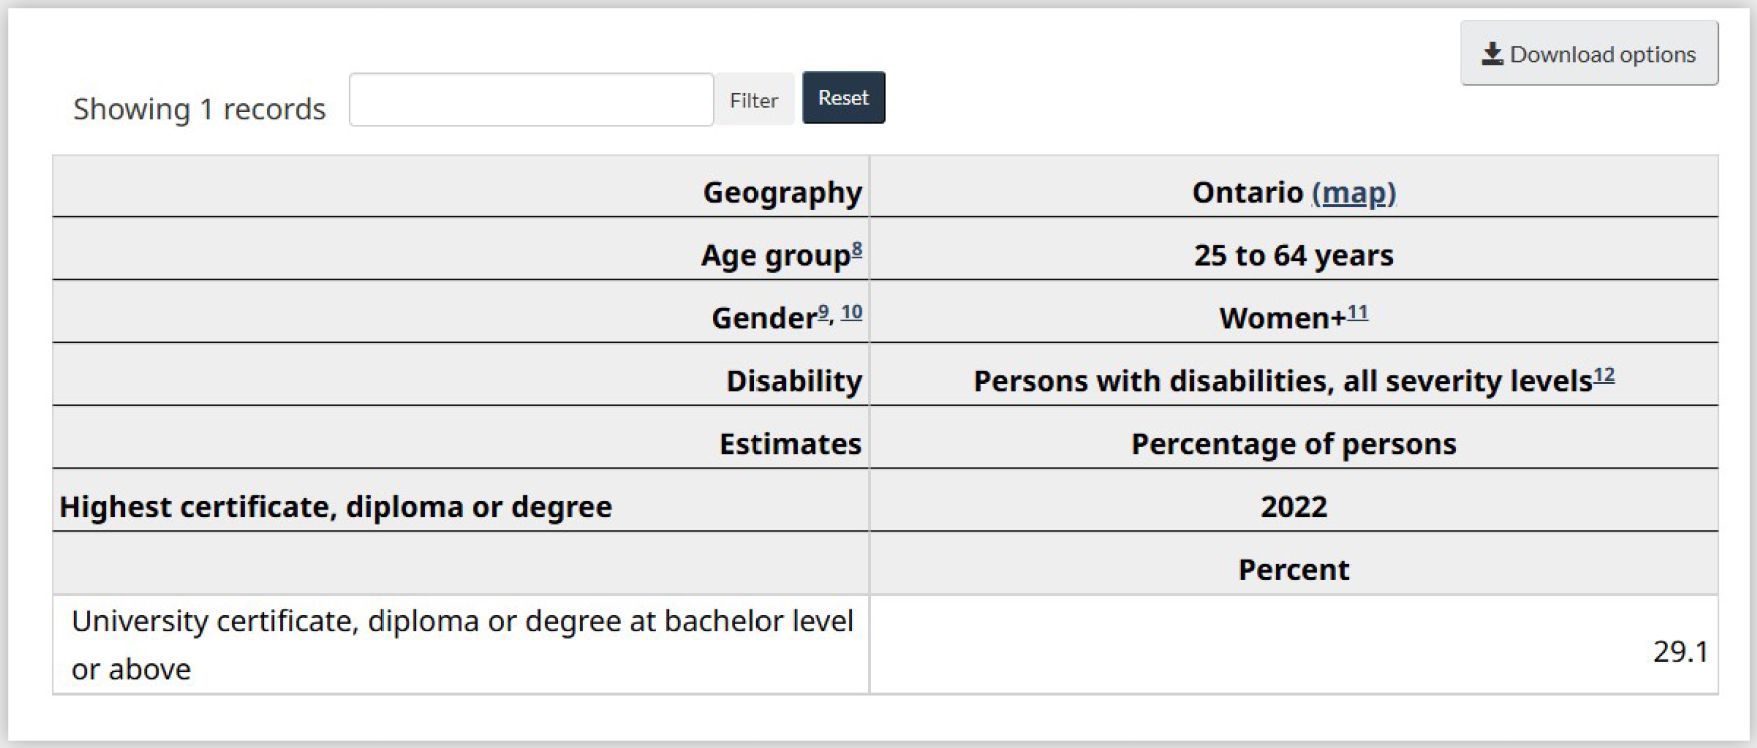
Figure 2 - Data table filtered to show one statistic
Data table filtered to show one statistic. The parameters are: Geography: Ontario; Age group: 25 to 64 years; Gender: Women; Disability: Persons with disabilities, all severity levels. The table displays Estimates – Percentage of persons, 2022, for the “Highest certificate, diploma or degree, it reports that 29.1% have a university certificate, diploma or degree at bachelor level or above.
Using Gender Results Framework indicators
The GDIS Hub also offers indicators aligned with the Gender Results Framework. These indicators may be filtered by disability and other population characteristics, supporting intersectional analysis.
Example
When clicking on the 'Gender-based violence and access to justice' pillar on the GDIS Hub main page, users are brought to the indicator "Workplaces are harassment-free". By filtering for 'Persons with disabilities' under the dropdown menu 'Population characteristics', users can view data specifically for employees with disabilities.
In Canada in 2020, 51.3% of employees with disabilities experienced workplace harassment, including sexual assault. Among those employees:
- 58.3% were women
- 41.0% were men.
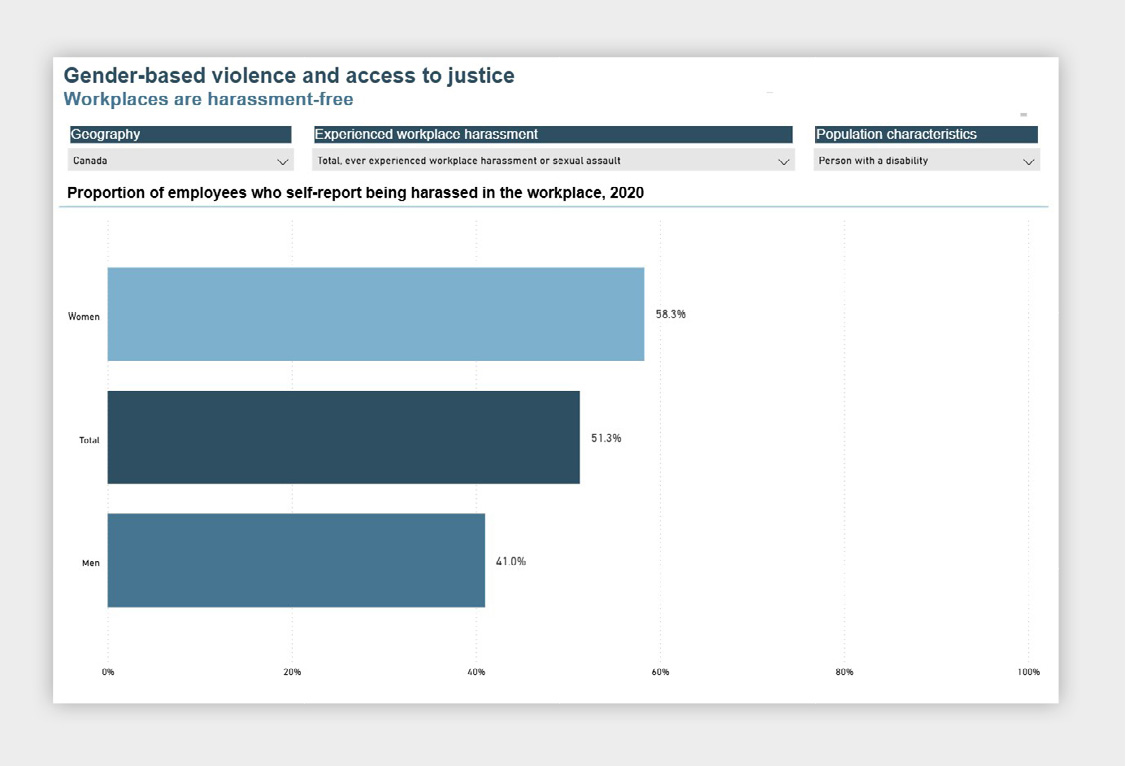
Figure 3 - Bar chart
Bar chart titled "Proportion of employees who self-reported being harassed in the workplace, 2020". It shows three horizontal bars by gender: Women (16.3%), Men (11.8%), and total (13.1%), indicating women report workplace harassment more frequently than men.
This highlights differences in experiences by gender and disability status, which can help inform programs and policies to improve workplace conditions and safety for employees with disabilities.
The underlying source for this indicator is Table 14-10-0407-01: Proportion of employees who self-report being harassed or sexually assaulted in the workplace.
To explore the data in more detail, users can open the Data Table and select "Add/Remove data" which allows to tailor the data to focus on persons with disabilities.
In the Add/Remove data panel, users can:
Select the population characteristics in the checklist-style filter menu with expandable categories, such as age groups, Indigenous / Non-Indigenous status, Person with disability, including a "Select all" and "Total, all persons" option; and additional characteristics such as the geography, reference period, and more, using the tab menu.
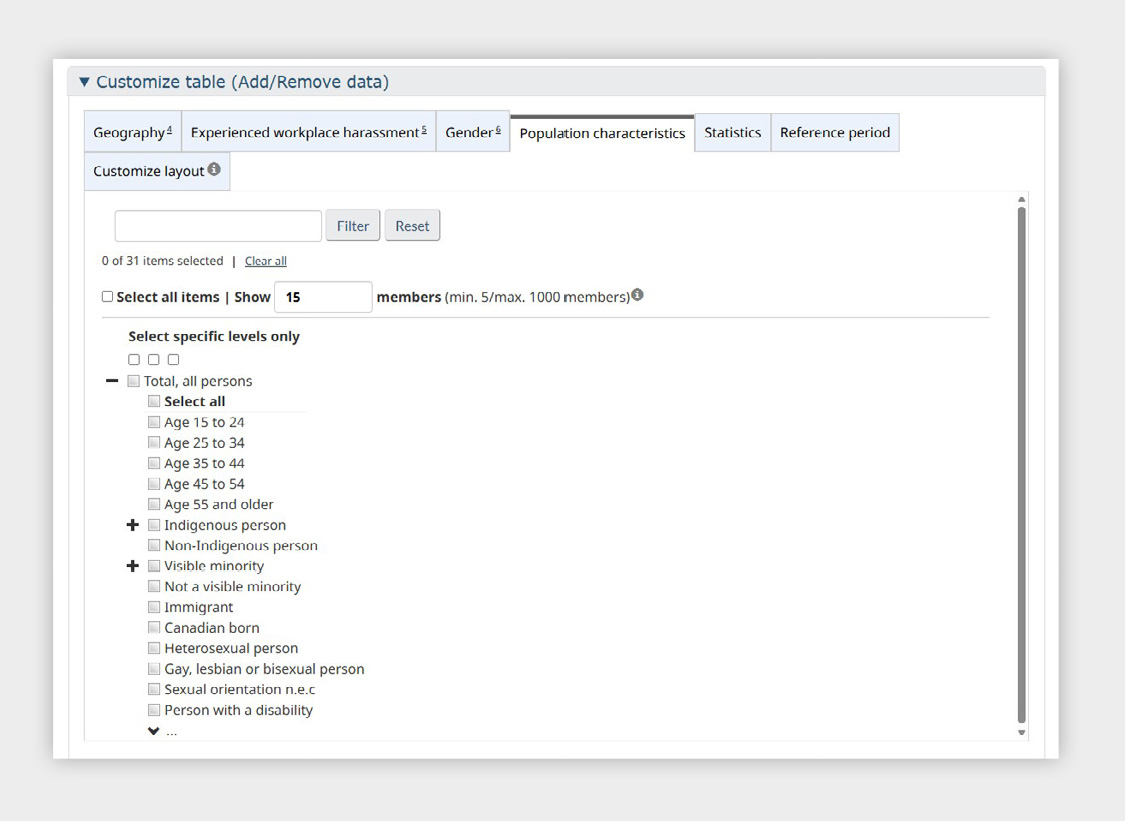
Figure 4 - A data table filter panel
A data table filter panel under the Population characteristics tab. It allows users to select variables such as Age groups, 15 to 24, 25 to 34, 35 to 44, 45 to 54, 55 and older, Indigenous person, Non-Indigenous person, Visible minority, Not a visible minority, Immigrant, Canadian-born, Gay, lesbian or bisexual person, and Person with a disability. At the top, the interface shows “0 of 31 items selected” and includes Filter and Reset buttons.
Example of customized table using the Add/Remove data feature: Persons with disabilities, women and men, employees aged 25 to 44 to compare reported workplace harassment rates by gender among persons with disabilities. Users can also change the reference period to examine trends over time.
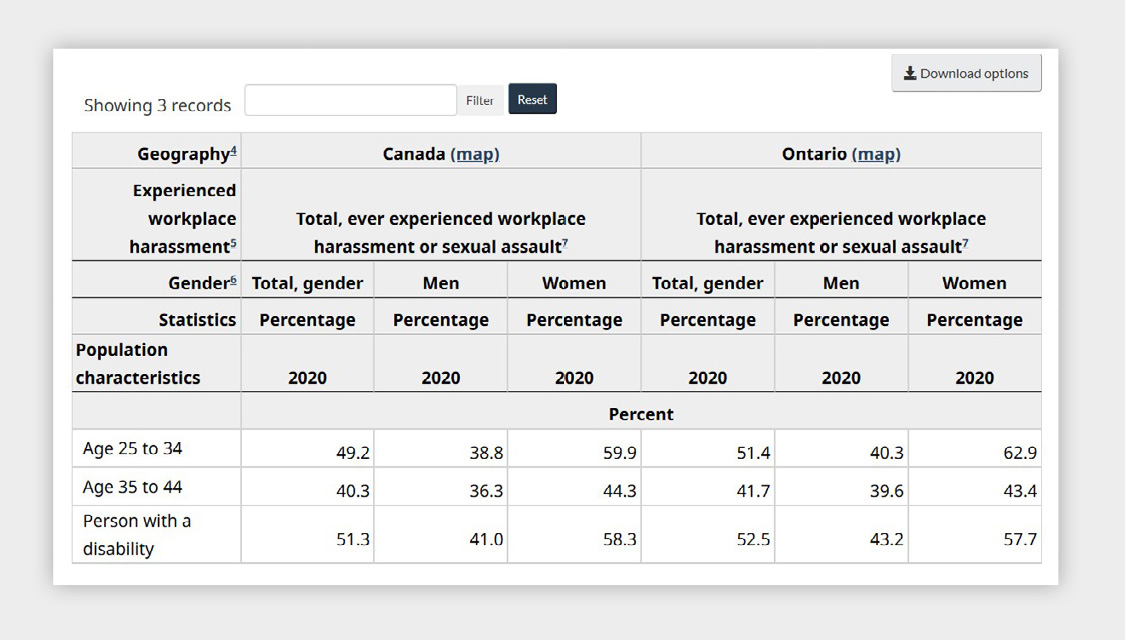
Figure 5 - Table comparing the percentage of people who experienced workplace harassment or sexual assault in 2020
Table comparing the percentage of people who experienced workplace harassment or sexual assault in 2020 in Canada and Ontario, broken down by gender and population characteristics. For ages 25 to 34, rates are Canada: Total 49.2%, Men 38.8%, Women 59.9%; Ontario: Total 51.4%, Men 40.3%, Women 62.9%. For ages 35 to 44, Canada: Total 40.3%, Men 36.3%, Women 44.3%; Ontario: Total 41.7%, Men 39.6%, Women 43.4%. For persons with a disability, Canada: Total 51.3%, Men 41.0%, Women 58.3%; Ontario: Total 52.5%, Men 43.2%, Women 57.7%.
Accessibility Statistics Hub: Complementary Source
The Accessibility Statistics Hub features all of Statistics Canada's data on disability and accessibility. The Hub is organized to feature the Performance Indicator Framework (PIF) for Accessibility Data, which represents the
Government of Canada's approach to measuring progress in the identification, removal, and prevention of barriers to accessibility over time, as required by the Accessible Canada Act. Data are organized according to the 7 priority areas as set out in the Act:
- Built environment
- Communication
- Program and service design and delivery
- Employment
- Information and communication technology
- Transportation
- Procurement
Within the Accessibility Statistics Hub, users can also access Statistics by subject: Disability, which provides a topic-focused view of disability-related content. This section brings together data tables, analytical articles, stats in brief, and survey documentation across a wide range of disability topics, complementing the hub's thematic organization.
Users can access this hub via the Related hubs and portals section on the GDIS Hub, or directly on Statistics Canada's website via the Subjects tab.
Related hubs and portals
Consult our subject specific hubs and portals for all the related data, analysis and reference resources. These pages contain information on topics important to the GDIS.
- Quality of Life Hub
- Accessibility Statistics
- Dimensions of Poverty Hub
- Immigration and ethnocultural diversity statistics
- Language Statistics
- Older adults and population aging statistics
- Rural Canada Statistics
- Statistics on Indigenous peoples
- Families, households and marital status statistics
- Immigrants and non-permanent residents statistics
- Children and youth statistics
Key takeaways
The Gender, Diversity and Inclusion Statistics Hub and other related Statistics Canada platforms provide multiple, complementary ways to explore disability and intersectional data in Canada.
- Start at the GDIS Hub
Access gender-disaggregated disability indicators, tables, and analysis to understand differences across groups, and help inform inclusive decision-making, as well as program and policy development. - Search the Catalogue
Find data on persons with disabilities across topics. - Apply Filters or Use CODR
Perform intersectional analysis with social and economic characteristics. - Drill Down to Data Tables
Move from GDIS indicators to underlying Statistics Canada tables for detailed data. - Explore the Accessibility Statistics Hub
Investigate accessibility, barriers, and supports. - Access Disability Data by Subject
Use Statistics by subject: Disability within the Accessibility Statistics Hub for topic-based disability data.
Together, these tools support users to explore and interpret disability data, how it intersects with other factors, application of Gender-based Analysis Plus, and how outcomes vary across various groups, geographies, and time.
Sign up to My StatCan to get updates in real-time.
- Date modified: