

March 22 is World Water Day, bringing awareness to a crisis in many parts of the world without access to this vital resource, or where access is difficult.
Here at home, this day is also an opportunity to look at how households and farms are conserving water, and to analyze data on the country’s freshwater resources.
Alberta households are most likely to have efficient toilets, along with certain cities in British Columbia and Ontario…
Every two years, the Households and the Environment Survey asks Canadian households in the provinces about their water-conservation practices. The latest data are from 2023, when almost half of households (48%) had a low-volume toilet, largely unchanged from 2011 (47%). Households in Alberta (51%) had the highest rate among the provinces, while British Columbia (50%) and Ontario (50%) were close behind.
Households in Barrie (63%), Ontario, and Kamloops (63%), Victoria (62%) and Nanaimo (62%), British Columbia, had the highest rates among census metropolitan areas (CMAs). Households in Peterborough (61%), Ontario, weren’t far behind.
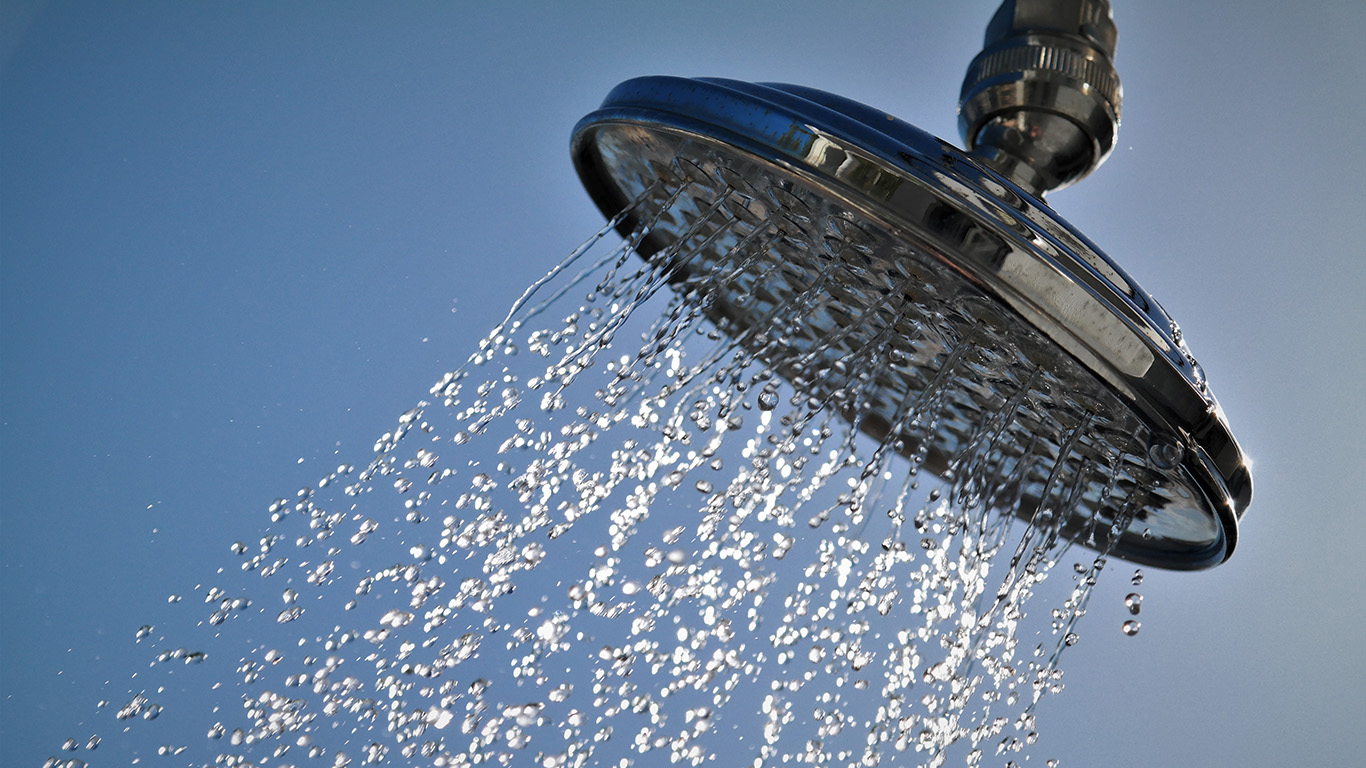
… which are also most likely to have efficient shower heads
A slightly smaller share of households reported having a low-flow shower head in 2023 (46%) than a low-volume toilet, a rate that was unchanged from 2021. Nova Scotia (52%) was tops among the provinces, followed by Quebec (50%).
Households in Kamloops (63%), Peterborough (61%), Nanaimo (60%) and Barrie (60%) again reached the top of the CMA list, which also included Saguenay (62%), Quebec.
Nationally, households with a non-municipal water supply, such as a private well, were more likely to have low-volume toilets and low-flow shower heads than those with municipally supplied water.
Households with a water meter are more likely to have conservation devices
More than one-third (38%) of Canadian households with a municipal water supply reported having a water meter. Those with a water meter were more likely than those without one to have a low-volume toilet (60% versus 44%), and the gap was slightly narrower for those reporting a low-flow shower head (54% versus 44%).
Rates varied greatly by region. Households in Quebec (10%) were the least likely among the provinces to have a water meter, as many of the province’s major urban areas are not metered. Just over one in four New Brunswick households (26%) had one.
Conversely, rates were highest among households in Alberta (62%) and Manitoba (58%). At the urban level, rates ranged from 60% to 71% among 11 CMAs in Alberta and Ontario.
Irrigation usage declines
Almost 1.9 billion cubic metres of water were used for irrigation on Canadian farms in 2024, down 9.8% from 2022.
The decreases seen in irrigation volume were slightly offset by increases in some drainage regions, such as in British Columbia.
Drainage regions are vast areas based on natural boundaries where surface water from rain, snowmelt or ice flows into a common outlet (e.g., river, lake or ocean).
Among the 6,378 farms that irrigated in 2024, more than two in five (2,689 farms) reported watering at night or in the morning—the most common response when asked about water and energy conservation practices. Fewer of them (2,122 farms) used water- or energy-saving nozzles. While farms reporting these two types of measures declined slightly from 2022, the number of farms that reported no conservation practices decreased by 21%.
Abundance of water
In 2020, freshwater bodies covered 12.6% of Canada’s inland area, or nearly 1.3 million square kilometres.
Water availability varies widely by area. For example, three of the top four drainage regions with the largest demand for freshwater—all in the Prairies—had the lowest renewable freshwater available to meet demand in 2021.
Conversely, coastal regions in British Columbia, Northern Quebec, and Newfoundland and Labrador had significant surpluses in the amount of precipitation compared with water lost to the atmosphere.
To learn more
Visit the Census of Environment portal for the latest data and insights, featuring a recently released analysis on protected terrestrial areas, which includes protected inland water bodies.

Contact information
For more information, contact the Statistical Information Service (toll-free 1-800-263-1136; 514-283-8300; infostats@statcan.gc.ca) or Media Relations (statcan.mediahotline-ligneinfomedias.statcan@statcan.gc.ca).