
Canada's doctoral students

Archived Content
Information identified as archived is provided for reference, research or recordkeeping purposes. It is not subject to the Government of Canada Web Standards and has not been altered or updated since it was archived. Please "contact us" to request a format other than those available.
Related information
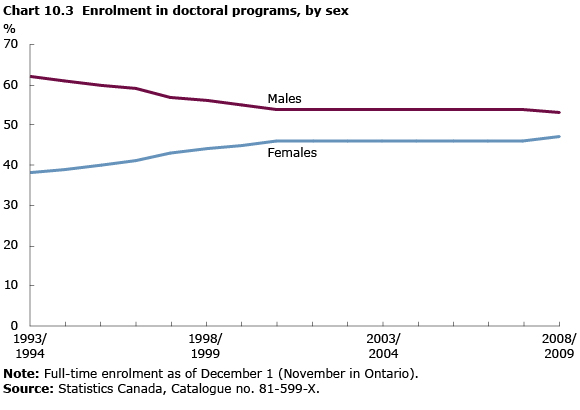
In the 2008/2009 school year, 47% of the 42,801 students enrolled in doctoral programs at Canadian universities were women.
Women and men tend to gravitate to different fields. In 2005, 83% of doctoral graduates in engineering were men, while 64% of doctoral graduates in psychology and social sciences were women.
At the time of graduation in 2005, the median age of doctoral graduates was 33. That year, 47% of doctoral graduates reported English as their mother tongue and 20% reported French, while 8% said a Chinese language was their mother tongue.
Visible minority students made up 28% of doctoral graduates, but the proportion of visible minorities varied by program. They represented 62% of graduates in engineering, 32% in computer, mathematics and physical sciences, 16% in psychology and social sciences, and 11% in the humanities.
- Date modified: