
Energy

Archived Content
Information identified as archived is provided for reference, research or recordkeeping purposes. It is not subject to the Government of Canada Web Standards and has not been altered or updated since it was archived. Please "contact us" to request a format other than those available.
Tables
- Table 28 Gasoline prices, selected urban centres
Charts
View tables
| 2000 | 2005 | 2010 | |
|---|---|---|---|
| cents per litre | |||
| St. John's | 83.0 | 102.1 | 110.8 |
| Charlottetown and Summerside | 70.1 | 96.4 | 101.2 |
| Halifax | 76.1 | 97.9 | 105.8 |
| Saint John | 73.3 | 97.9 | 99.9 |
| Québec | 71.9 | 97.5 | 106.5 |
| Montréal | 77.2 | 96.4 | 107.8 |
| Ottawa | 69.0 | 88.5 | 100.5 |
| Toronto | 70.8 | 89.0 | 101.9 |
| Thunder Bay | 72.6 | 94.0 | 107.3 |
| Winnipeg | 66.7 | 90.0 | 97.5 |
| Regina | 71.7 | 92.7 | 101.9 |
| Saskatoon | 71.7 | 93.5 | 101.4 |
| Edmonton | 63.5 | 85.1 | 90.2 |
| Calgary | 64.0 | 85.8 | 92.9 |
| Vancouver | 69.1 | 97.1 | 115.3 |
| Victoria | 73.5 | 99.2 | 109.2 |
| Whitehorse | 81.4 | 105.5 | 112.5 |
| Yellowknife | 85.4 | 105.0 | 116.9 |
| Note: Average annual price of regular unleaded gasoline at self-service filling stations. | |||
| Source: Statistics Canada, CANSIM table 326-0009. | |||
View charts
Chart 16 Selected energy price indexes
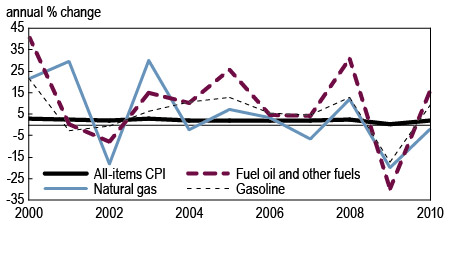
Source: Statistics Canada, CANSIM table 326-0021.
Chart 17 Energy exports
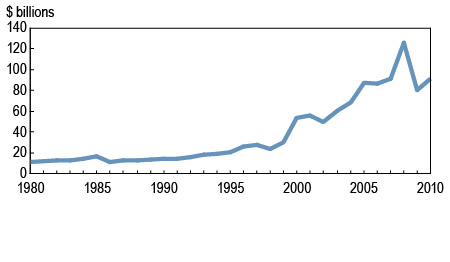
Note: Balance of payments basis.
Source: Statistics Canada, CANSIM table 228-0043.
- Date modified: