Enhancing the ability to search for Statistics Canada data - Consultative engagement
Current status: open
Consultation period: February 24, 2026 to March 31, 2026
Enhancing the ability to search for Statistics Canada data - Consultative engagement
Consultation period: February 24, 2026 to March 31, 2026
| Month | |
|---|---|
| 202512 | |
| Geography | % |
| Canada | 0.5 |
| Newfoundland and Labrador | 2.2 |
| Prince Edward Island | 0.5 |
| Nova Scotia | 1.3 |
| New Brunswick | 1.9 |
| Quebec | 1.3 |
| Ontario | 1.0 |
| Manitoba | 1.0 |
| Saskatchewan | 2.3 |
| Alberta | 0.8 |
| British Columbia | 1.1 |
| Yukon Territory | 6.2 |
| Northwest Territories | 1.7 |
| Nunavut | 2.6 |
| Duration of Trip | Main Trip Purpose | Country or Region of Trip Destination | |||||||
|---|---|---|---|---|---|---|---|---|---|
| Total | Canada | United States | Overseas | ||||||
| Person-Trips (x 1,000) | C.V. | Person-Trips (x 1,000) | C.V. | Person-Trips (x 1,000) | C.V. | Person-Trips (x 1,000) | C.V. | ||
| Total Duration | Total Main Trip Purpose | 103,235 | A | 95,219 | A | 5,098 | B | 2,918 | A |
| Holiday, leisure or recreation | 51,938 | A | 47,342 | A | 2,703 | B | 1,893 | B | |
| Visit friends or relatives | 33,081 | A | 31,423 | A | 995 | B | 663 | B | |
| Personal conference, convention or trade show | 1,419 | D | 1,070 | E | 345 | E | 5 | E | |
| Shopping, non-routine | 4,634 | B | 4,109 | B | 524 | D | .. | ||
| Other personal reasons | 5,730 | B | 5,340 | B | 266 | D | 124 | E | |
| Business conference, convention or trade show | 1,582 | C | 1,348 | C | 105 | D | 128 | D | |
| Other business | 4,851 | B | 4,586 | B | 160 | D | 105 | E | |
| Same-Day | Total Main Trip Purpose | 58,814 | A | 56,615 | A | 2,199 | B | .. | |
| Holiday, leisure or recreation | 27,357 | A | 26,244 | A | 1,113 | C | .. | ||
| Visit friends or relatives | 17,862 | A | 17,624 | A | 238 | D | .. | ||
| Personal conference, convention or trade show | 873 | D | 697 | D | F | .. | |||
| Shopping, non-routine | 4,414 | B | 3,912 | B | 502 | D | .. | ||
| Other personal reasons | 4,216 | B | 4,067 | B | 150 | E | .. | ||
| Business conference, convention or trade show | 522 | D | 520 | D | F | .. | |||
| Other business | 3,569 | C | 3,551 | C | 18 | E | .. | ||
| Overnight | Total Main Trip Purpose | 44,422 | A | 38,603 | A | 2,900 | A | 2,918 | A |
| Holiday, leisure or recreation | 24,581 | A | 21,098 | A | 1,590 | B | 1,893 | B | |
| Visit friends or relatives | 15,220 | A | 13,799 | A | 757 | B | 663 | B | |
| Personal conference, convention or trade show | 546 | E | 373 | E | 169 | E | 5 | E | |
| Shopping, non-routine | 220 | D | 198 | E | F | .. | |||
| Other personal reasons | 1,514 | B | 1,273 | B | 117 | D | 124 | E | |
| Business conference, convention or trade show | 1,060 | C | 829 | C | 103 | D | 128 | D | |
| Other business | 1,281 | B | 1,034 | B | 142 | D | 105 | E | |
Estimates contained in this table have been assigned a letter to indicate their coefficient of variation (c.v.) (expressed as a percentage). The letter grades represent the following coefficients of variation:
|
|||||||||
2026 Census of Agriculture dissemination: Closed consultation
Consultation period: February 1, 2024 to April 30, 2024
Results published: October 1, 2025, see What we heard
| Duration of Visit | Main Trip Purpose | Country or Region of Expenditures | |||||||
|---|---|---|---|---|---|---|---|---|---|
| Total | Canada | United States | Overseas | ||||||
| $ '000 | C.V. | $ '000 | C.V. | $ '000 | C.V. | $ '000 | C.V. | ||
| Total Duration | Total Main Trip Purpose | 42,398,009 | A | 30,490,918 | A | 4,955,639 | B | 6,951,452 | B |
| Holiday, leisure or recreation | 25,599,039 | A | 17,480,953 | A | 3,210,400 | B | 4,907,686 | C | |
| Visit friends or relatives | 9,880,320 | A | 7,787,562 | A | 838,345 | D | 1,254,413 | B | |
| Personal conference, convention or trade show | 801,297 | E | 571,328 | E | 214,165 | E | 15,804 | E | |
| Shopping, non-routine | 971,032 | C | 877,378 | C | 93,654 | E |
.. |
||
| Other personal reasons | 1,816,033 | D | 1,466,067 | B | 186,648 | E | 163,319 | E | |
| Business conference, convention or trade show | 1,435,209 | C | 792,151 | D | 151,373 | D | 491,685 | E | |
| Other business | 1,895,079 | B | 1,515,478 | B | 261,055 | E | 118,546 | D | |
| Same-Day | Total Main Trip Purpose | 7,863,798 | B | 7,436,121 | B | 369,258 | C | 58,419 | D |
| Holiday, leisure or recreation | 3,983,766 | B | 3,706,844 | B | 219,189 | D | 57,733 | D | |
| Visit friends or relatives | 1,725,436 | B | 1,669,355 | B | 55,396 | E | F | ||
| Personal conference, convention or trade show | 186,839 | E | 181,186 | E | F | .. | |||
| Shopping, non-routine | 855,567 | C | 783,746 | C | 71,821 | E | .. | ||
| Other personal reasons | 664,389 | D | 650,698 | D | 13,691 | E | .. | ||
| Business conference, convention or trade show | 49,361 | D | 48,369 | D | F | .. | |||
| Other business | 398,440 | C | 395,924 | C | 2,516 | E | .. | ||
| Overnight | Total Main Trip Purpose | 34,534,211 | A | 23,054,796 | A | 4,586,381 | B | 6,893,034 | B |
| Holiday, leisure or recreation | 21,615,273 | B | 13,774,109 | B | 2,991,211 | B | 4,849,953 | C | |
| Visit friends or relatives | 8,154,884 | B | 6,118,208 | B | 782,949 | D | 1,253,727 | B | |
| Personal conference, convention or trade show | 614,458 | E | 390,142 | E | 208,511 | E | 15,804 | E | |
| Shopping, non-routine | 115,465 | D | 93,632 | D | F | .. | |||
| Other personal reasons | 1,151,644 | E | 815,368 | B | 172,957 | E | 163,319 | E | |
| Business conference, convention or trade show | 1,385,848 | C | 743,782 | D | 150,381 | D | 491,685 | E | |
| Other business | 1,496,639 | B | 1,119,554 | B | 258,539 | E | 118,546 | D | |
Estimates contained in this table have been assigned a letter to indicate their coefficient of variation (c.v.) (expressed as a percentage). The letter grades represent the following coefficients of variation:
|
|||||||||
| Province of residence | Unweighted | Weighted |
|---|---|---|
| Percentage | ||
| Newfoundland and Labrador | 21.0 | 16.1 |
| Prince Edward Island | 18.2 | 17.3 |
| Nova Scotia | 22.9 | 19.4 |
| New Brunswick | 22.0 | 18.7 |
| Quebec | 24.6 | 21.3 |
| Ontario | 25.7 | 23.7 |
| Manitoba | 26.1 | 21.2 |
| Saskatchewan | 24.1 | 21.4 |
| Alberta | 22.4 | 19.4 |
| British Columbia | 26.2 | 24.1 |
| Canada | 24.3 | 22.1 |
The reductions identified in the Government of Canada’s Budget 2025 and the Comprehensive Expenditure Review confirmed Statistics Canada’s need to streamline operations while continuing to deliver the trusted data Canadians rely on. These government-wide measures are intended to reduce spending on operations while protecting priority programs and investing in areas that support Canada’s economic and social well-being.
In response, Statistics Canada entered a workforce adjustment period in January 2026 and has made targeted adjustments to programs to ensure the long-term sustainability of Canada’s national statistical system. Our most critical programs, such as the Census of Population, the Consumer Price Index, gross domestic product, trade, and employment statistics, continue without interruption. These core indicators remain priorities and will continue to be available to governments, businesses, and communities across the country.
Most changes affect how data are collected and produced, rather than the availability of data. To reduce duplication and focus resources where they have the greatest impact, some surveys and statistical programs will be discontinued where the data can be obtained through alternative sources or methods. Statistics Canada will continue to deliver trusted data by increasing the use of administrative data, modelling, automation and artificial intelligence, and by adjusting release frequency or level of detail where appropriate, while maintaining the quality, integrity, and continuity of Canada’s key national indicators.
Throughout this period of change, Statistics Canada remains committed to responsible stewardship of public resources and to fulfilling its mandate under the Statistics Act. Whether we collect administrative, alternative, or survey data, one thing remains certain—Statistics Canada continues to operate in accordance with governing instruments and frameworks, including those guiding the use of automation and artificial intelligence, and our commitment to protecting privacy and safeguarding the confidentiality of data remains unwavering. As Canada’s national statistical agency, Statistics Canada continues to provide high-quality, objective, and trusted data that support informed decision-making and public confidence in official statistics.
Statistics Canada has identified several program adjustments that will help us meet our expenditure reduction requirements for the Comprehensive Expenditure Review.
These decisions were made through a thorough, agency-wide process that looked at what Canadians rely on most and where changes could be made with the least impact. As a result, these adjustments aim to ensure organizational stability and sustainability while continuing to provide high-quality data and trusted information to Canadians, even with reduced funding.
There will be reductions in scope, frequency and/or granularity to elements of various statistical programs, including the following specific changes:
The objective of this text is to provide a general overview of the balance of payments-basis data produced by the Canadian International Merchandise Trade (CIMT) Program, with special reference to concepts and definitions.
1. Objectives and coverage: The objective of balance of payments-basis CIMT statistics is to measure the change in economic transactions that involve merchandise trade between residents and non-residents. Information on imports and exports are inputs into the Macroeconomic Accounts, and are used in the formulation of trade and economic policies. Governments, importers, exporters, manufacturers and shipping companies use international merchandise trade statistics to:
2. Trade statistics (customs-basis/balance of payments-basis): Merchandise trade statistics are presented on two different bases: customs and balance of payments.
Statistics for Canada’s imports as well as exports to non-US destinations are compiled from Customs declarations filed with the Canada Border Services Agency (CBSA). Data for Canada’s exports to the United States are derived from the administrative import records of the United States Customs and Border Protection and exchanged under the terms of a memorandum of understanding between Canada and the United States. Statistics developed from these Customs administrative records are commonly referred to as customs-basis trade statistics.
Customs-basis data are adjusted to conform to the National Accounts concepts and definitions. The adjustments to derive balance of payments-basis trade data include adjustments related to trade definition, valuation and timing. The principal difference between the two trade concepts is that customs-basis merchandise trade statistics cover the physical movement of goods as they are reflected in Customs documents while balance of payments-basis data are intended to cover economic transactions that involve merchandise trade between residents and non-residents.
It is possible for the accuracy of customs-basis statistics to be affected by undercoverage and/or country misallocation. Undercoverage occurs when trade is not captured in customs documents. Examples of undercoverage include transactions where the value is below the threshold required for reporting to customs authorities, and the informal or illegal movement of goods across borders. Estimates for undercoverage are included in balance of payments-basis statistics. Country misallocation occurs when the last known destination reported on the customs export documentation does not reflect the ultimate destination for the goods. This occurs most frequently when goods are routed through an intermediary country before continuing to their final destination with the intermediary country being reported as the final destination of the goods.
3. Valuation: For Customs purposes, imports are recorded at values established according to the provisions of the Customs Act, which reflects valuation methods based on the General Agreement on Tariffs and Trade (GATT) Valuation Code System. In general, the value for duty of imported goods must be equivalent to the transaction value or the price actually paid.
The transaction value of imported goods includes all transportation and associated costs incurred up to the point of direct shipment to Canada. Therefore, Canada's imports are valued Free on Board (FOB), place of direct shipment to Canada. It excludes freight and insurance costs in bringing the goods to Canada from the point of direct shipment.
Exports are recorded at the value declared on Customs documents, which reflect the transaction value (i.e., actual selling price or, in the case of a non-arm's length transaction, the transfer price used for company accounting purposes). Canada's exports are valued at FOB port of exit from Canada, including domestic freight charges to that point but net of discounts and allowances.
4. Statistical period: In theory, the statistical period for balance of payments-basis trade statistics reflects the month during which change of ownership occurred. Since this can be difficult to determine, in practice, the statistical period for balance of payments-basis statistics reflects the month during which the goods cleared Customs. The closing of the statistical month for imports and exports is defined as the last calendar day of the month based on the date of clearance from Customs. Documents received too late for incorporation in the current month are assigned to the month the transaction took place and are published the following statistical month.
5. Trading partner attribution (country of origin/destination): On a custom basis, imports are attributed to the country of origin, that is the country in which the goods were grown, extracted or manufactured in accordance with the rules of origin administered by the CBSA. On a balance of payments-basis, imports are attributed to the country of export instead of the country of origin to reflect the change in ownership of the goods.
Both customs- and balance of payments-basis exports are attributed to the country that is the last known destination of the goods at the time of export.
6. Principal Trading Partners (PTPs): The list of PTPs is based on their annual share of total trade — merchandise imports plus exports — with Canada in 2012. The countries included in the list of PTPs are the following:
List of Canada's Principal Trading Partners
7. Legal framework: Import and export statistics with countries other than the United States are derived from information contained in administrative records collected by the CBSA under the Customs Act. Copies of these documents (or information therefrom) are sent to Statistics Canada in accordance with Section 25 of the Statistics Act. It follows that the disclosure of trade statistics is governed by both the Customs Act and the Statistics Act and is subject to the provisions of Section 17(2)(a) of the latter. Disclosure of statistics for trade with the United States is governed by a memorandum of understanding that provides for the exchange of detailed import statistics between Canada and the United States.
Telephone: 1-800-263-1136
Facsimile: 1-877-287-4369
Email: infostats@statcan.gc.ca

Statement outlining results, risks and significant changes in operations, personnel and program
Statistics Canada ("the agency") is a member of the Innovation, Science and Industry portfolio.
Statistics Canada's role is to ensure that Canadians have access to a trusted source of statistics on Canada that meets their highest priority needs.
The agency's mandate derives primarily from the Statistics Act. The Act requires that the agency collects, compiles, analyzes and publishes statistical information on the economic, social, and general conditions of the country and its people. It also requires that Statistics Canada conduct the Census of Population and the Census of Agriculture every fifth year and protects the confidentiality of the information with which it is entrusted.
Statistics Canada also has a mandate to co-ordinate and lead the national statistical system. The agency is considered a leader, among statistical agencies around the world, in co–ordinating statistical activities to reduce duplication and reporting burden.
More information on Statistics Canada's mandate, roles, responsibilities and programs can be found in the 2025-2026 Main Estimates and in the Statistics Canada 2025-2026 Departmental Plan.
The Quarterly Financial Report:
Statistics Canada has the authority to collect and spend revenue from other federal government departments and agencies, as well as from external clients, for statistical services and products.
This quarterly report has been prepared by management using an expenditure basis of accounting. The accompanying Statement of Authorities includes the agency's spending authorities granted by Parliament and those used by the agency consistent with the Main Estimates for the 2025-2026 fiscal year. This quarterly report has been prepared using a special purpose financial reporting framework designed to meet financial information needs with respect to the use of spending authorities.
The authority of Parliament is required before moneys can be spent by the Government. Approvals are given in the form of annually approved limits through appropriation acts or through legislation in the form of statutory spending authority for specific purposes.
The agency uses the full accrual method of accounting to prepare and present its annual departmental financial statements that are part of the departmental results reporting process. However, the spending authorities voted by Parliament remain on an expenditure basis.
This section highlights the significant items that contributed to the net increase in resources available for the year, as well as actual expenditures for the quarter ended December 31.
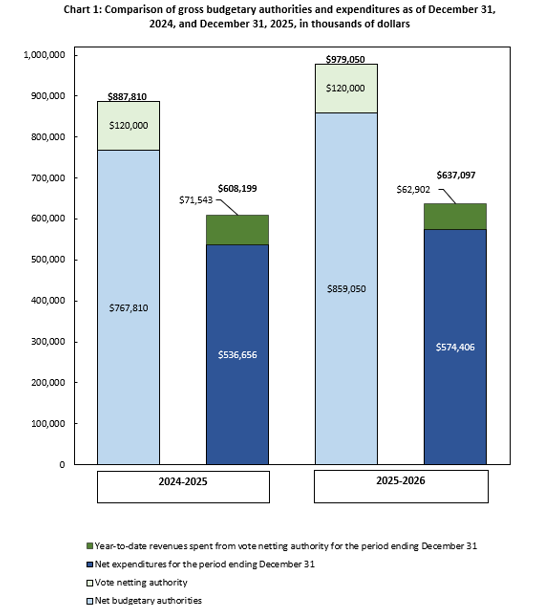
This bar graph shows Statistics Canada's budgetary authorities and expenditures, in thousands of dollars, as of December 31, 2024 and 2025:
Chart 1 outlines the gross budgetary authorities, which represent the resources available for use for the year as of December 31.
Total authorities available for 2025-26 have increased by $91.2 million, or 10.3%, from the previous year, from $887.8 million to $979 million (Chart 1). The net increase is mostly the result of the following:
In addition to the appropriations allocated to the agency through the Main Estimates, Statistics Canada also has vote net authority within Vote 1, which entitles the agency to spend revenues collected from other federal government departments, agencies, and external clients to provide statistical services. The vote netting authority is stable at $120 million when comparing the third quarter of fiscal years 2024-2025 and 2025-2026.
Year-to-date net expenditures recorded to the end of the third quarter increased by $37.7 million, or 7% from the previous year, from $536.7 million to $574.4 million (see Table A: Variation in Departmental Expenditures by Standard Object).
Statistics Canada spent approximately 66.9% of its authorities by the end of the third quarter, compared with 69.9% in the same quarter of 2024-2025.
| Departmental Expenditures Variation by Standard Object: | Q3 year-to-date variation between fiscal year 2024-2025 and 2025-2026 |
|
|---|---|---|
| $'000 | % | |
| (01) Personnel | 20,232 | 3.7 |
| (02) Transportation and communications | 1,434 | 12.3 |
| (03) Information | 5,188 | 100.6 |
| (04) Professional and special services | -3,350 | -18.5 |
| (05) Rentals | 4,784 | 18.4 |
| (06) Repair and maintenance | 49 | 12.1 |
| (07) Utilities, materials and supplies | 1,604 | 225.3 |
| (08) Acquisition of land, buildings and works | -23 | -63.9 |
| (09) Acquisition of machinery and equipment | -940 | -40.8 |
| (10) Transfer payments | - | - |
| (12) Other subsidies and payments | 132 | 36.6 |
| Total gross budgetary expenditures | 29,109 | 4.8 |
| Less revenues netted against expenditures: | ||
| Revenues | -8,641 | -12.1 |
| Total net budgetary expenditures | 37,750 | 7.0 |
| Note: Explanations are provided for variances of more than $1 million. | ||
Personnel: The increase is primarily due to salary price increases and costs related to the employee benefit plan. To accommodate the cyclical nature of some of Statistics Canada’s programs, including the Census of Population program, resources have been reallocated within the agency.
Transportation and communications: The increase is mainly due to timing differences in invoicing compared to last fiscal year in relation to the connectivity and telecommunications support provided by Shared Services Canada for the 2026 Census of Population.
Information: The increase is mainly due to advertisement and printing costs for 2026 Census of Population materials such as questionnaires, envelopes, and letters.
Professional and special services: The decrease is attributable to the salaries of workers hired under the Statistics Act to operate the Census Help Line and to undertake data collection work during the Census Test, which began and ended in 2024. These operations will commence shortly for the 2026 Census. Also contributing is a reduction in IT consultant costs. Additionally, there has been timing differences in invoicing compared to last year.
Rentals: The increase is mainly due to additional costs for logistical requirements for the 2026 Census of Population, as well as timing differences in invoicing compared to last year.
Utilities, materials and supplies: The increase is mainly due to additional costs for office supplies needed for the 2026 Census of Population.
Revenues: The increase is mainly due to timing differences in invoicing compared to last year.
In 2025-26, the following changes in operations, personnel and program activities are underway:
Statistics Canada continues to address financial and operational uncertainties through its corporate risk management framework. Budget variations, particularly from cyclical programs such as the Census and anticipated adjustments stemming from the Comprehensive Expenditure Review are being managed through agile planning and strategic resource management. To ensure long-term financial sustainability, the agency is strengthening partnerships with government entities and modernizing its digital infrastructure.
To support its modernization efforts, Statistics Canada is strengthening its statistical operations and continuing to invest in workforce development and organizational efficiency. The agency remains dedicated to fostering an inclusive and diverse workplace while streamlining operations and optimizing resources. Through continued collaboration with federal partners, the agency is reinforcing its financial stewardship and ensuring a resilient, adaptable organization that meets the evolving needs of Canadians.
Approved by:
André Loranger, Chief Statistician
Ottawa, Ontario
Signed on: February 9, 2026
Kathleen Mitchell, Chief Financial Officer
Ottawa, Ontario
Signed on: February 3, 2026
| Fiscal year 2025-2026 | Fiscal year 2024–2025 | |||||
|---|---|---|---|---|---|---|
| Total available for use for the year ending March 31, 2026Table note * | Used during the quarter ended December 31, 2025 | Year-to-date used at quarter-end | Total available for use for the year ending March 31, 2025Table note * | Used during the quarter ended December 31, 2024 | Year-to-date used at quarter-end | |
| in thousands of dollars | ||||||
| Vote 1 — Net operating expenditures | 755,124 | 154,186 | 496,552 | 679,138 | 126,562 | 470,342 |
| Statutory authority — Contribution to employee benefit plans | 103,926 | 25,951 | 77,854 | 88,672 | 22,105 | 66,314 |
| Total budgetary authorities | 859,050 | 180,137 | 574,406 | 767,810 | 148,667 | 536,656 |
|
||||||
| Fiscal year 2025-2026 | Fiscal year 2024–2025 | |||||
|---|---|---|---|---|---|---|
| Planned expenditures for the year ending March 31, 2026 | Expended during the quarter ended December 31, 2025 | Year-to-date used at quarter-end | Planned expenditures for the year ending March 31, 2025 | Expended during the quarter ended December 31, 2024 | Year-to-date used at quarter-end | |
| in thousands of dollars | ||||||
| Expenditures: | ||||||
| (01) Personnel | 812,216 | 188,748 | 563,655 | 744,253 | 183,572 | 543,423 |
| (02) Transportation and communications | 32,317 | 5,241 | 13,086 | 20,048 | 4,130 | 11,652 |
| (03) Information | 15,029 | 6,482 | 10,345 | 23,141 | 1,743 | 5,157 |
| (04) Professional and special services | 49,469 | 6,408 | 14,803 | 41,537 | 7,866 | 18,154 |
| (05) Rentals | 52,701 | 13,081 | 30,783 | 38,973 | 4,447 | 25,999 |
| (06) Repair and maintenance | 1,327 | 228 | 451 | 1,245 | 188 | 402 |
| (07) Utilities, materials and supplies | 2,722 | 1,546 | 2,316 | 1,439 | 273 | 712 |
| (08) Acquisition of land, buildings and works | 507 | 12 | 13 | 632 | 36 | 36 |
| (09) Acquisition of machinery and equipment | 9,071 | -135 | 1,362 | 12,615 | 896 | 2,302 |
| (10) Transfer payments | - | - | - | - | - | - |
| (12) Other subsidies and payments | 3,691 | 217 | 494 | 3,927 | 154 | 362 |
| Total gross budgetary expenditures | 979,050 | 221,828 | 637,308 | 887,810 | 203,305 | 608,199 |
| Less revenues netted against expenditures: | ||||||
| Revenues | 120,000 | 41,691 | 62,902 | 120,000 | 54,638 | 71,543 |
| Total revenues netted against expenditures | 120,000 | 41,691 | 62,902 | 120,000 | 54,638 | 71,543 |
| Total net budgetary expenditures | 859,050 | 180,137 | 574,406 | 767,810 | 148,667 | 536,656 |