
Gender, Diversity and Inclusion Statistics Hub
Welcome to the Gender, Diversity and Inclusion Statistics (GDIS) Hub, Statistics Canada's primary platform for all Gender, Diversity and Inclusion related data. The Hub enables data users to find more easily disaggregated and intersectional data, analytical products and insights.
Find what matters, faster.
Explore data directly through the Gender, Diversity and Inclusion Statistics Catalogue – a searchable database of tables, publications, and visualizations on gender, diversity and inclusion. Use expanded population identity groups and social and economic characteristics to quickly find relevant, disaggregated data. Scroll down to Explore the data – Gender, Diversity and Inclusion Statistics Catalogue to start your search.
Gender Results Framework
Statistics Canada has compiled data on each of the indicators of the Gender Results Framework as well as other key indicators related to gender.
Dashboards are available below for Education and skills development, Economic participation and prosperity, Leadership and democratic participation, Gender-based violence and access to justice, Poverty reduction, health and well-being and other Statistics Canada gender indicators, allowing users to view and interact with relevant data.
New to the dashboards? Visit the "Learning resources" page to access a video tutorial and fact sheets that provide step-by-step guidance on how to navigate the dashboards, explore disaggregated data and conduct intersectional analysis.


Explore the data
Gender, Diversity and Inclusion Statistics Catalogue

The GDIS catalogue is a searchable database that helps you find data tables, publications, and data visualizations on gender, diversity and inclusion. It features disaggregated data and analytical products that you can search by keyword or filter by population identity group, social and economic characteristics, or type of product.
For a broader range of topics and information, visit the Statistics Canada website.
Browse the GDIS catalogueWhat's new

National Indigenous History Month
Statistics Canada honours National Indigenous History Month in June by recognizing and celebrating the rich histories, cultures, languages and traditions of First Nations, Métis and Inuit across Canada.
This month also provides an opportunity to reflect on the importance of reconciliation and to learn more about the experiences, contributions and resilience of Indigenous Peoples.
Here are some valuable resources to learn more about Indigenous Peoples:
- Child care participation among off-reserve First Nations, Métis and Inuit children aged 1 to 5: Exploring parental satisfaction and cultural responsiveness across child care settings
- Métis youth: Experiences and outcomes in secondary and postsecondary learning
- The importance of cultural continuity in foster care for the long-term mental health of Indigenous people in Canada
- Migration of Indigenous people to and from First Nations reserves, 2016 to 2021
- Response mobility to Indigenous identification questions in Canada, 2016 to 2021
- Indigenous employment and income in indigenous-owned businesses: A comparative analysis
- Core housing need among First Nations people living off reserve, Métis and Inuit, 2022
- Inuktut in Nunavut: Results from the 2021 Census
- Knowledge of Inuktut among Inuit in Nunavut

Pride Season
Pride Season refers to the wide range of Pride events held across Canada from June to September, when 2SLGBTQI+ communities and allies come together to spotlight resilience, celebrate talent, and recognize the contributions of 2SLGBTQI+ people and communities.
To learn more about the experiences and well-being of 2SLGBTQI+ communities, explore these recent Statistics Canada resources:
- Socioeconomic outcomes of transgender and non-binary people in Canada
- Community and well-being: Exploring sense of belonging among youth
- Unfair treatment, racism and discrimination in community sports in Canada
- Police-reported hate crime in Canada, 2024
- Preliminary quarterly hate and cybercrime data
Recent releases
View all recent releases in the GDIS catalogue.
The Daily articles
Infographics
Data Visualization Tool:
Canada's Transgender and Non-Binary Population
Explore data with our Canada's Transgender and Non-Binary Population: Data Visualization Tool by age for province, territories and Census Metropolitan Areas (CMAs) based on data from the 2021 Census of Population.
Additional information
Social inclusion statistics for Canada's ethnocultural groups
Welcome to the Social Inclusion portal linked to Canada's Anti-Racism Strategy and the Centre for Gender, Diversity and Inclusion Statistics. This portal brings together key statistical information on the inclusion (or exclusion) of ethnocultural groups and immigrants in Canada.
More information on social inclusion indicators for Canada's ethnocultural groups
More information on social inclusion indicators for Canada's ethnocultural groups

This one-stop data portal introduces a framework to organize and access data on social inclusion for ethnocultural groups and immigrants in Canada and responds to an increased demand for statistical indicators to support evidence-based decision-making aimed at building a more equitable and inclusive society.
The social inclusion indicators published on this portal cover 11 themes relevant to the analysis of social inclusion and are drawn from a variety of data sources.
Themes of social inclusion:
- Participation in the labour market
- Representation in decision-making positions
- Civic engagement and political participation
- Basic needs and housing
- Health and well-being
- Income and wealth
- Social connections and personal networks
- Education and skills development
- Public services and institutions
- Local community
- Discrimination and victimization
Data sources:
- Censuses of Population
- Canadian Housing Survey
- General Social Survey - Social Identity
- General Social Survey - Victimization
- Canadian Community Health Survey
- Uniform Crime Reporting Survey
Tables on social inclusion indicators
Data tables on social inclusion indicators
- Table 43-10-0058-01 - Feeling part of the community and neighbourhood satisfaction, safety feeling and economic hardship, by visible minority and selected characteristics
- Table 43-10-0059-01 - Perceptions of police performance and personal safety satisfaction, by visible minority and selected characteristics
- Table 43-10-0060-01 - Selected housing characteristics, low income indicators and knowledge of official languages, by visible minority and other characteristics for the population in private households
- Table 43-10-0063-01 - Size and composition of personal networks (local, close relatives, close friends, acquaintances), by visible minority and selected characteristics
- Table 43-10-0073-01 - Selected economic housing characteristics, by visible minority and other sociodemographic characteristics for the population in private households
- Table 43-10-0061-01 - Experience(s) of discrimination, reason(s) and context(s) of discrimination 5 years before and since the beginning of COVID-19 pandemic, by groups designated as visible minorities and selected sociodemographic characteristics, 2020
- Table 43-10-0062-01 - Confidence in Canadian institutions, by groups designated as visible minorities and selected sociodemographic characteristics, 2020
- Table 43-10-0064-01 - Sense of belonging to the local community, town, province and Canada and trust in people, by groups designated as visible minorities and selected sociodemographic characteristics, 2020
- Table 43-10-0065-01 - Civic engagement and engagement in political activities, by groups designated as visible minorities and selected sociodemographic characteristics, 2020
- Table 43-10-0066-01 - Vote in the last federal, provincial and municipal elections, by groups designated as visible minorities and selected sociodemographic characteristics, 2020
- Table 43-10-0067-01 - Highest certificate, degree or diploma, by groups designated as visible minorities and selected sociodemographic characteristics for the population aged 15 years and over, 2006, 2011 and 2016
- Table 43-10-0068-01 - Average employment income indicators, by groups designated as visible minorities and selected sociodemographic characteristics for the population aged 15 years and over in private households, 2006, 2011 and 2016
- Table 43-10-0069-01 - Selected labour force status, by groups designated as visible minorities and selected sociodemographic characteristics for the population aged 15 years and over in private households, 2006, 2011 and 2016
- Table 43-10-0070-01 - Selected management occupations and self-employed class of worker, by groups designated as visible minorities and selected sociodemographic characteristics for the employed labour force aged 15 years and over in private households, 2006, 2011 and 2016
- Table 43-10-0071-01 - Overqualification rate, by groups designated as visible minorities and selected sociodemographic characteristics for the employed labour force population aged 15 years and over in private households, 2011 and 2016
- Table 43-10-0072-01 - Youth not in employment, education or training in percent, by groups designated as visible minorities and selected sociodemographic characteristics for the population aged 15 to 29 years, 2006, 2011 and 2016
- Table 13-10-0841-01 - Health indicators by groups designated as visible minorities and selected demographic characteristics, 2019-2020
- Table 13-10-0842-01 - Health indicators by groups designated as visible minorities and selected sociodemographic characteristics, 2019-2020
- Table 35-10-0066-01 - Police-reported hate crime, by type of motivation, Canada (selected police services)
Analytical products on social inclusion
- Data visualization tools — Social inclusion indicators for Canada's ethnocultural groups
- Reference guide on social inclusion indicators for Canada's ethnocultural groups
- The Daily - Social inclusion statistics for Canada's ethnocultural groups: New Products!
- The Daily - Housing conditions among racialized groups: A brief overview
- The Daily - Portrait of the social, political and economic participation of racialized groups
Disaggregated Data Action Plan
What is disaggregated data?
Disaggregated data are data broken down from large datasets into smaller segments such as gender, region, ethnicity or a combination of these to reveal underlying trends and differences between and within individual segments that may not be reflected in aggregated data.
Disaggregated data can better inform our understanding of the experiences of diverse people. The more a dataset is disaggregated, the more it is representative of the characteristics of the individuals that comprise the dataset. Without intersectional disaggregated data, data users risk inferring information about individuals and subpopulations based on inferences about the larger group. Thus, disaggregated data are needed to provide a more accurate and nuanced picture of the Canadian population.
Led by Statistics Canada, the Disaggregated Data Action Plan (DDAP) adopts a whole-of-government approach to provide all levels of government, businesses, policymakers, data users, non-profit organizations and the Canadian population with the detailed insights necessary for evidence-based decision-making for a more equitable Canada.
To the extent possible, data for each population group are broken down into subcategories according to gender, ethnocultural characteristics, age, sexual orientation and disability—or intersections of these and other subcategories, as needed. Data are also disaggregated to the lowest possible level of geography, as events affect people differently depending on where they live.
The Disaggregated Data Action Plan 2024-25 Accomplishment Report: From Commitment to Continuity presents the most recent progress made toward advancing representative data collection and strengthening statistics about Indigenous Peoples, women, racialized groups, persons with disabilities, and other population groups.
Previous DDAP Accomplishment Reports continue to be available through publications.gc.ca.
For more information on the Disaggregated Data Action Plan and related initiatives, please visit the Disaggregated Data Action Plan page.
Consultative engagement activities
Statistics Canada is committed to engaging with partners, stakeholders, community organizations, researchers and the public to ensure that concepts, terminology and statistical products reflect Canada's evolving social realities and data needs.
This page provides access to current and past consultative engagement activities relevant to the Gender, Diversity and Inclusion Statistics Hub, including consultations and published results.
Gender-based Analysis Plus (GBA Plus)
Gender-based Analysis Plus (GBA Plus) is an analytical tool used to support the development of responsive and inclusive policies, programs, and other initiatives. GBA Plus is a process for understanding who is impacted by the issue or opportunity being addressed by the initiative; identifying how the initiative could be tailored to meet diverse needs of the people most impacted; and anticipating and mitigating any barriers to accessing or benefitting from the initiative. GBA Plus is an intersectional analysis that goes beyond biological (sex) and socio-cultural (gender) differences to consider other factors, such as age, disability, education, ethnicity, economic status, geography (including rurality), language, race, religion, and sexual orientation.
For additional information and resources on GBA Plus, check out the following links:
- Gender-based Analysis Plus (GBA Plus) - Women and Gender Equality Canada
- Gender-Based Violence Knowledge Centre - Women and Gender Equality Canada
- Health Inequalities Data Tool - Public Health Infobase
- Take the Gender-based Analysis Plus course - Women and Gender Equality Canada
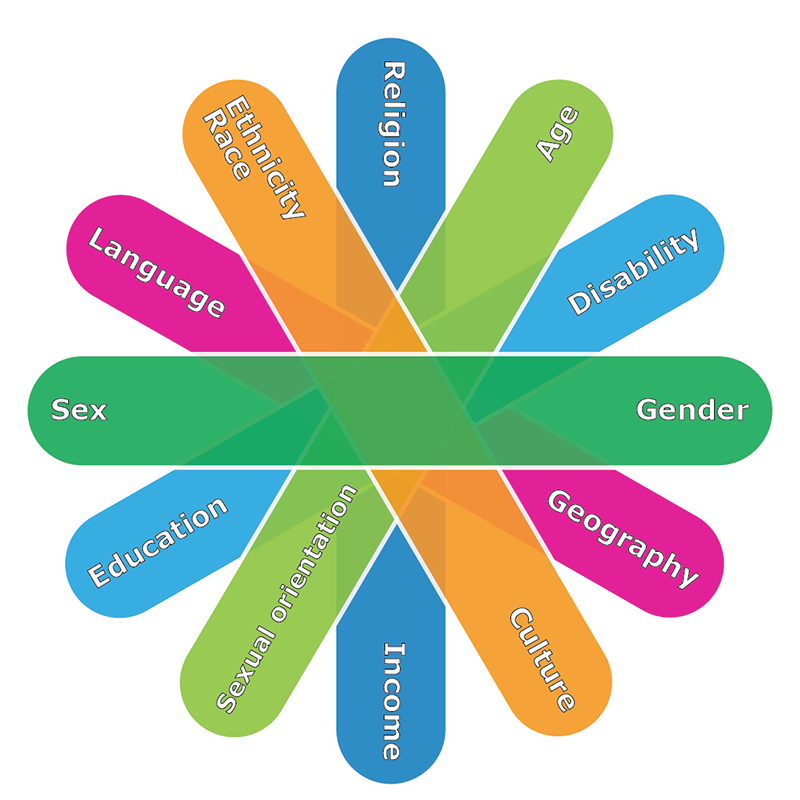
Description: Diversity Wheel
This figure illustrates some of the factors which can intersect with sex and gender. Six oblong shapes of differing colors overlap and fan out. Each oblong has two identity factors written on it. The top oblong has "sex and gender". Starting below sex and gender and going clockwise, the additional identities identified are: geography, culture, income, sexual orientation, education, language, race, ethnicity, religion, age and disability.
Framework and standards
Framework: The Sustainable Development Goals (SDGs) are a universal call to action to end poverty, protect the planet and improve the lives and prospects of everyone, everywhere. The Canadian Indicator Framework for the SDGs encompasses the 17 goals to support Canada's domestic implementation of the SDGs.
Standards: Statistical data and metadata standards are a set of rules about how data and metadata are managed, organized, represented, or formatted. They enable consistent and repeatable description, representation, structuring, and sharing of data and metadata.
Enhancing Data to Support Better Decision-Making for Canadians
The Government of Canada (GC) has announced the release of new gender and sex assigned at birth standards, which aim to improve the way data is collected, analyzed, and used across the country. These standards, which are aligned with Statistics Canada's own practices, are an essential part of efforts to modernize how the government approaches data on sex and gender.
What Are the New Standards and Why Do They Matter?
The Gender, sex at birth, sexual orientation, and related standards by variable are designed to ensure that data collected by the government is consistent, accurate, and reflective of the diversity within the Canadian population. By following these standards, the government can ensure that all datasets are comparable, making it easier to understand trends and differences across different regions and communities.
The standards will also support Disaggregated Data Action Plan - data that is broken down into smaller, more detailed categories, such as gender, ethnicity, and region. This enables a deeper understanding of the experiences of Canadians from various backgrounds. For example, the use of disaggregated data can uncover trends or challenges that may not be visible in broader, aggregated data, allowing for more targeted and effective policies and programs.
Collaborative Efforts
The development of these standards involved close collaboration between multiple government agencies, including Statistics Canada, the Office of the Chief Data Officer, and various other departments. These partnerships were crucial in ensuring the standards are both comprehensive and reflective of the needs of the Canadian public.
Where to find standards
You can explore all available GC Enterprise Data Reference Standards and policies while linking directly to the original standards on the data stewards' sites. This information can also be accessed on the Open Government Portal. Statistics Canada created Gender of Person and Sex at Birth of Person reference guides. Each guide provides information on the standard, including useful links to the variable, classification(s) and reference documentation, as well as details on the questions used. Access Statistics Canada's complete repository of standard classifications, variables and statistical units by visiting Standards, data sources and methods. This page brings together information that will assist in the interpretation of Statistics Canada's published data.
International initiatives
Sustainable Development Goals and Gender Equality
Goal 5 - Gender equality of the United Nations Sustainable Development Goals is to achieve gender equality and empower all women and girls.
Gender in the international context
Related hubs and portals
Visit other hubs and portals
Consult our subject specific hubs and portals for all the related data, analysis and reference resources. These pages contain information on topics important to the GDIS.
Sign up to My StatCan to get updates in real-time.
- Date modified: