

Canada is recognized globally as a leader in renewable energy. In fact, Canada ranked as the fourth‑largest global producer of renewable electricity in 2023 despite its relatively low population.
It draws power from a mix of sources that include hydroelectric, thermal, nuclear, as well as expanding wind, solar and biomass sources. The country continues to modernize how energy is produced and used, with renewables and electrification playing central roles.
But demand for electricity is rising. As more people switch to electric vehicles, industries electrify and digital technologies expand, Canada's energy needs are projected to grow by 62% from 2025 to 2050.
Capital investment in electricity generation increases
In response to these growing demands, capital investment in electricity generation facilities in Canada increased by 31.8% from 2018 to 2024. In 2024, more than four-fifths (83.3%) of the $11.8 billion in capital expenditures on power plants were directed at non-emitting electricity sources (hydro, nuclear, wind, solar and biomass).
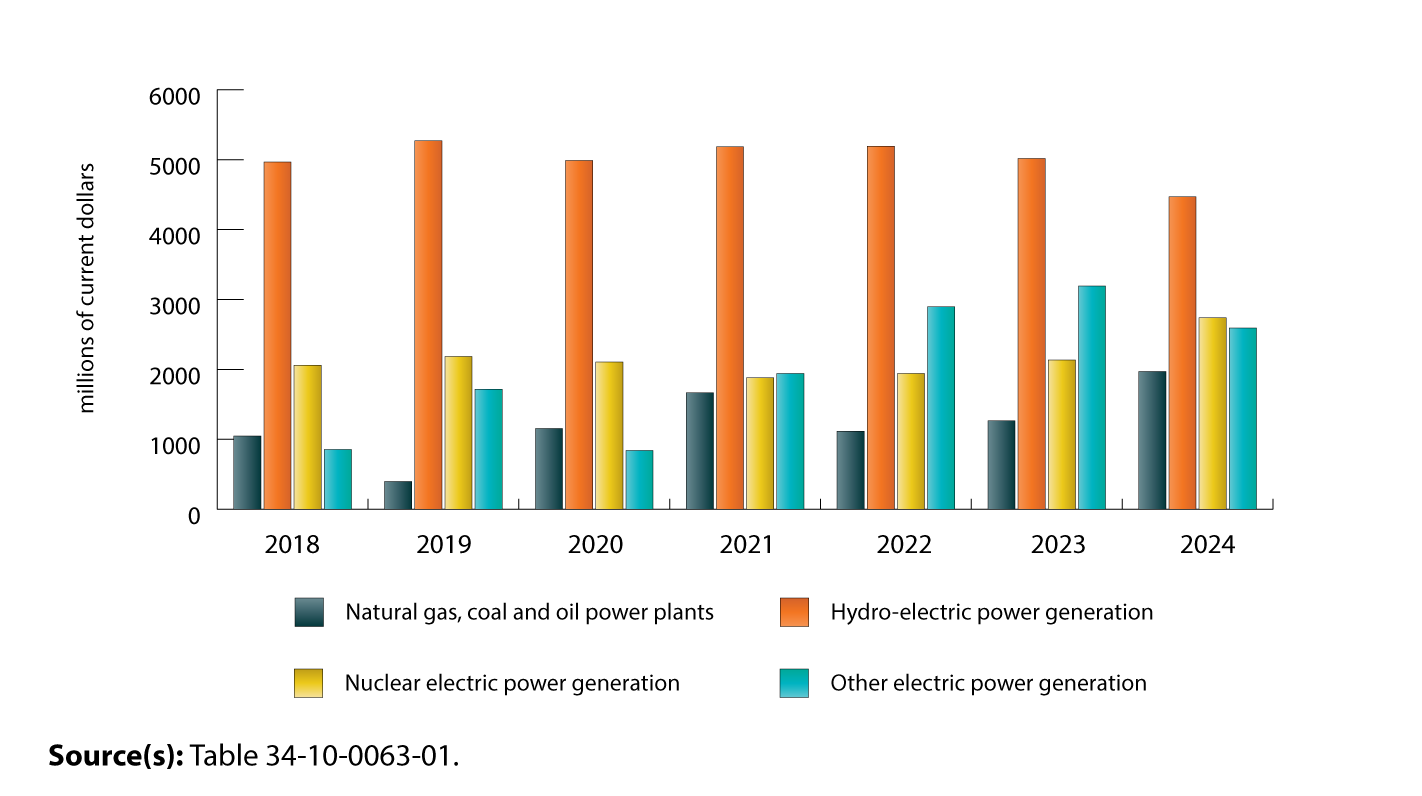
Chart 1: Capital investment in electric power generation
Description - Chart 1: Capital investment in electric power generation
The title of this chart is “Capital investment in electric power generation.”
This is a vertical bar chart.
The vertical axis shows millions of dollars, from 0 to 6,000, in increments of 1,000.
The title of the vertical axis is “millions of current dollars”.
The horizontal axis shows the years from 2018 to 2024, in chronological order from left to right.
There are four series for each year, and each series represents a different type of power source. The first series represents natural gas, coal, and oil power plants. The second series represents hydro-electric power generation. The third series represents nuclear electric power generation. The fourth series represents other electric power generation.
In 2018, the first series is at 1,049.6, the second series is at 4,968, the third series is at 2,059.6, and the fourth series is at 855.4.
In 2019, the first series is at 398.8, the second series is at 5,268.6, the third series is at 2,184.7, and the fourth series is at 1,175.5.
In 2020, the first series is at 1,155.4, the second series is at 4,987.1, the third series is at 2,107.8, and the fourth series is at 841.2.
In 2021, the first series is at 1,667.6, the second series is at 5,182.6, the third series is at 1,880.8, and the fourth series is at 1,941.5.
In 2022, the first series is at 1,116.9, the second series is at 5,190.3, the third series is at 1,941.3, and the fourth series is at 2,895.1.
In 2023, the first series is at 1,265.6, the second series is at 5,017, the third series is at 2,133.7, and the fourth series is at 3,192.8.
In 2024, the first series is at 1,970.8, the second series is at 4,471, the third series is at 2,737.7, and the fourth series is at 2,594.1.
Source(s): Table 34-10-0063-01.
Hydroelectric generation makes up more than one-third of electric power plants capital spending
Canada is one of the world’s largest producers of hydroelectricity and relies on it as the backbone of its grid, and ongoing projects reflect that.
For example, the Site C Clean Energy Project in British Columbia will provide 1 100 megawatts (MW) of capacity and 5.1 million megawatt-hours (MWh) of electricity each year, enough to power 450,000 homes per year in that province. The total cost of this project was expected to reach $16 billion upon completion in 2025. Capital investment in hydro-electric power plants accounted for $4.5 billion in 2024, more than one-third (38%) of all electric power plants capital expenditures in Canada.
Ontario drives nuclear investment
Nuclear power ranks second among Canada’s non-emitting electricity sources, though it is the third-largest source of electricity overall due to the continued use of emitting combustibles. It plays a critical role in providing stable, reliable power, especially in Ontario. Although non-emitting, nuclear is not considered renewable due to finite uranium resources, yet it remains essential for grid stability and long-term decarbonization.
There are currently multiple refurbishment or new construction projects underway, including those in Darlington, Bruce, and Pickering, with the goal of 28 000 MW of future generation capacity. In 2024, more than one-fifth (22.2%) of all capital investment into electric power generation facilities in Canada went to nuclear power plant investment in Ontario, and nuclear power plant investment in that province grew by more than one-third (+34.7%) from 2018.
Wind and solar capacity expected to double by 2035
Wind and solar power generation capacity have been expanding significantly since 2010, supported by lower costs, procurement programs, and provincial market reforms. As of 2025, provinces such as Alberta, Ontario and Quebec show substantial installed capacity in utility‑scale wind, solar, and storage. Nationwide capacity is now approximately 25 million MW and is projected to double by 2035.
Capital investment in other power generating facilities (wind, solar, biomass) increased by 203.3% from 2018 to 2024 and accounted for more than one-fifth (22.0%) of all investments in power generation facilities in 2024. Several major projects across Canada were completed in 2024 and 2025, including the Summerside Sunbank Project in Prince Edward Island, the Neweg Energy Project in New Brunswick, the Apuiat Wind Farm in Quebec, the Bekevar Wind Energy Project in Saskatchewan, and the Buffalo Plains Wind Farm, Halkirk Wind 2 and Big Sky Solar Farm projects in Alberta.
Note to readers
All data in this article from the Capital and Repair Expenditures Survey are presented in current dollars. This means that measuring growth over a particular time period does not take into account inflation. Growth in constant dollars would be at a far slower pace than in the examples in the article. According to the implicit price indexes for non-residential structures, an increase of 28% in expenditures from 2018 to 2024 was attributable to inflation.

Contact information
For more information, contact the Statistical Information Service (toll-free 1-800-263-1136; 514-283-8300; infostats@statcan.gc.ca) or Media Relations (statcan.mediahotline-ligneinfomedias.statcan@statcan.gc.ca).