


Production of crude oil and equivalent products rose for the fifth consecutive year in 2025, up 4.0% from 2024 and reaching a new annual record of 310.9 million cubic metres.
Increased production in Alberta drove the overall increase, following the completion of the expanded Trans Mountain pipeline. In operation for its first full year in 2025, the pipeline eased the export bottleneck, which has limited Canadian crude production in the past, and has provided new opportunities to deliver Canadian crude oil to markets in Asia. Production in Newfoundland and Labrador also rose in 2025, as some offshore oil platforms came back online, following extended maintenance in 2024.
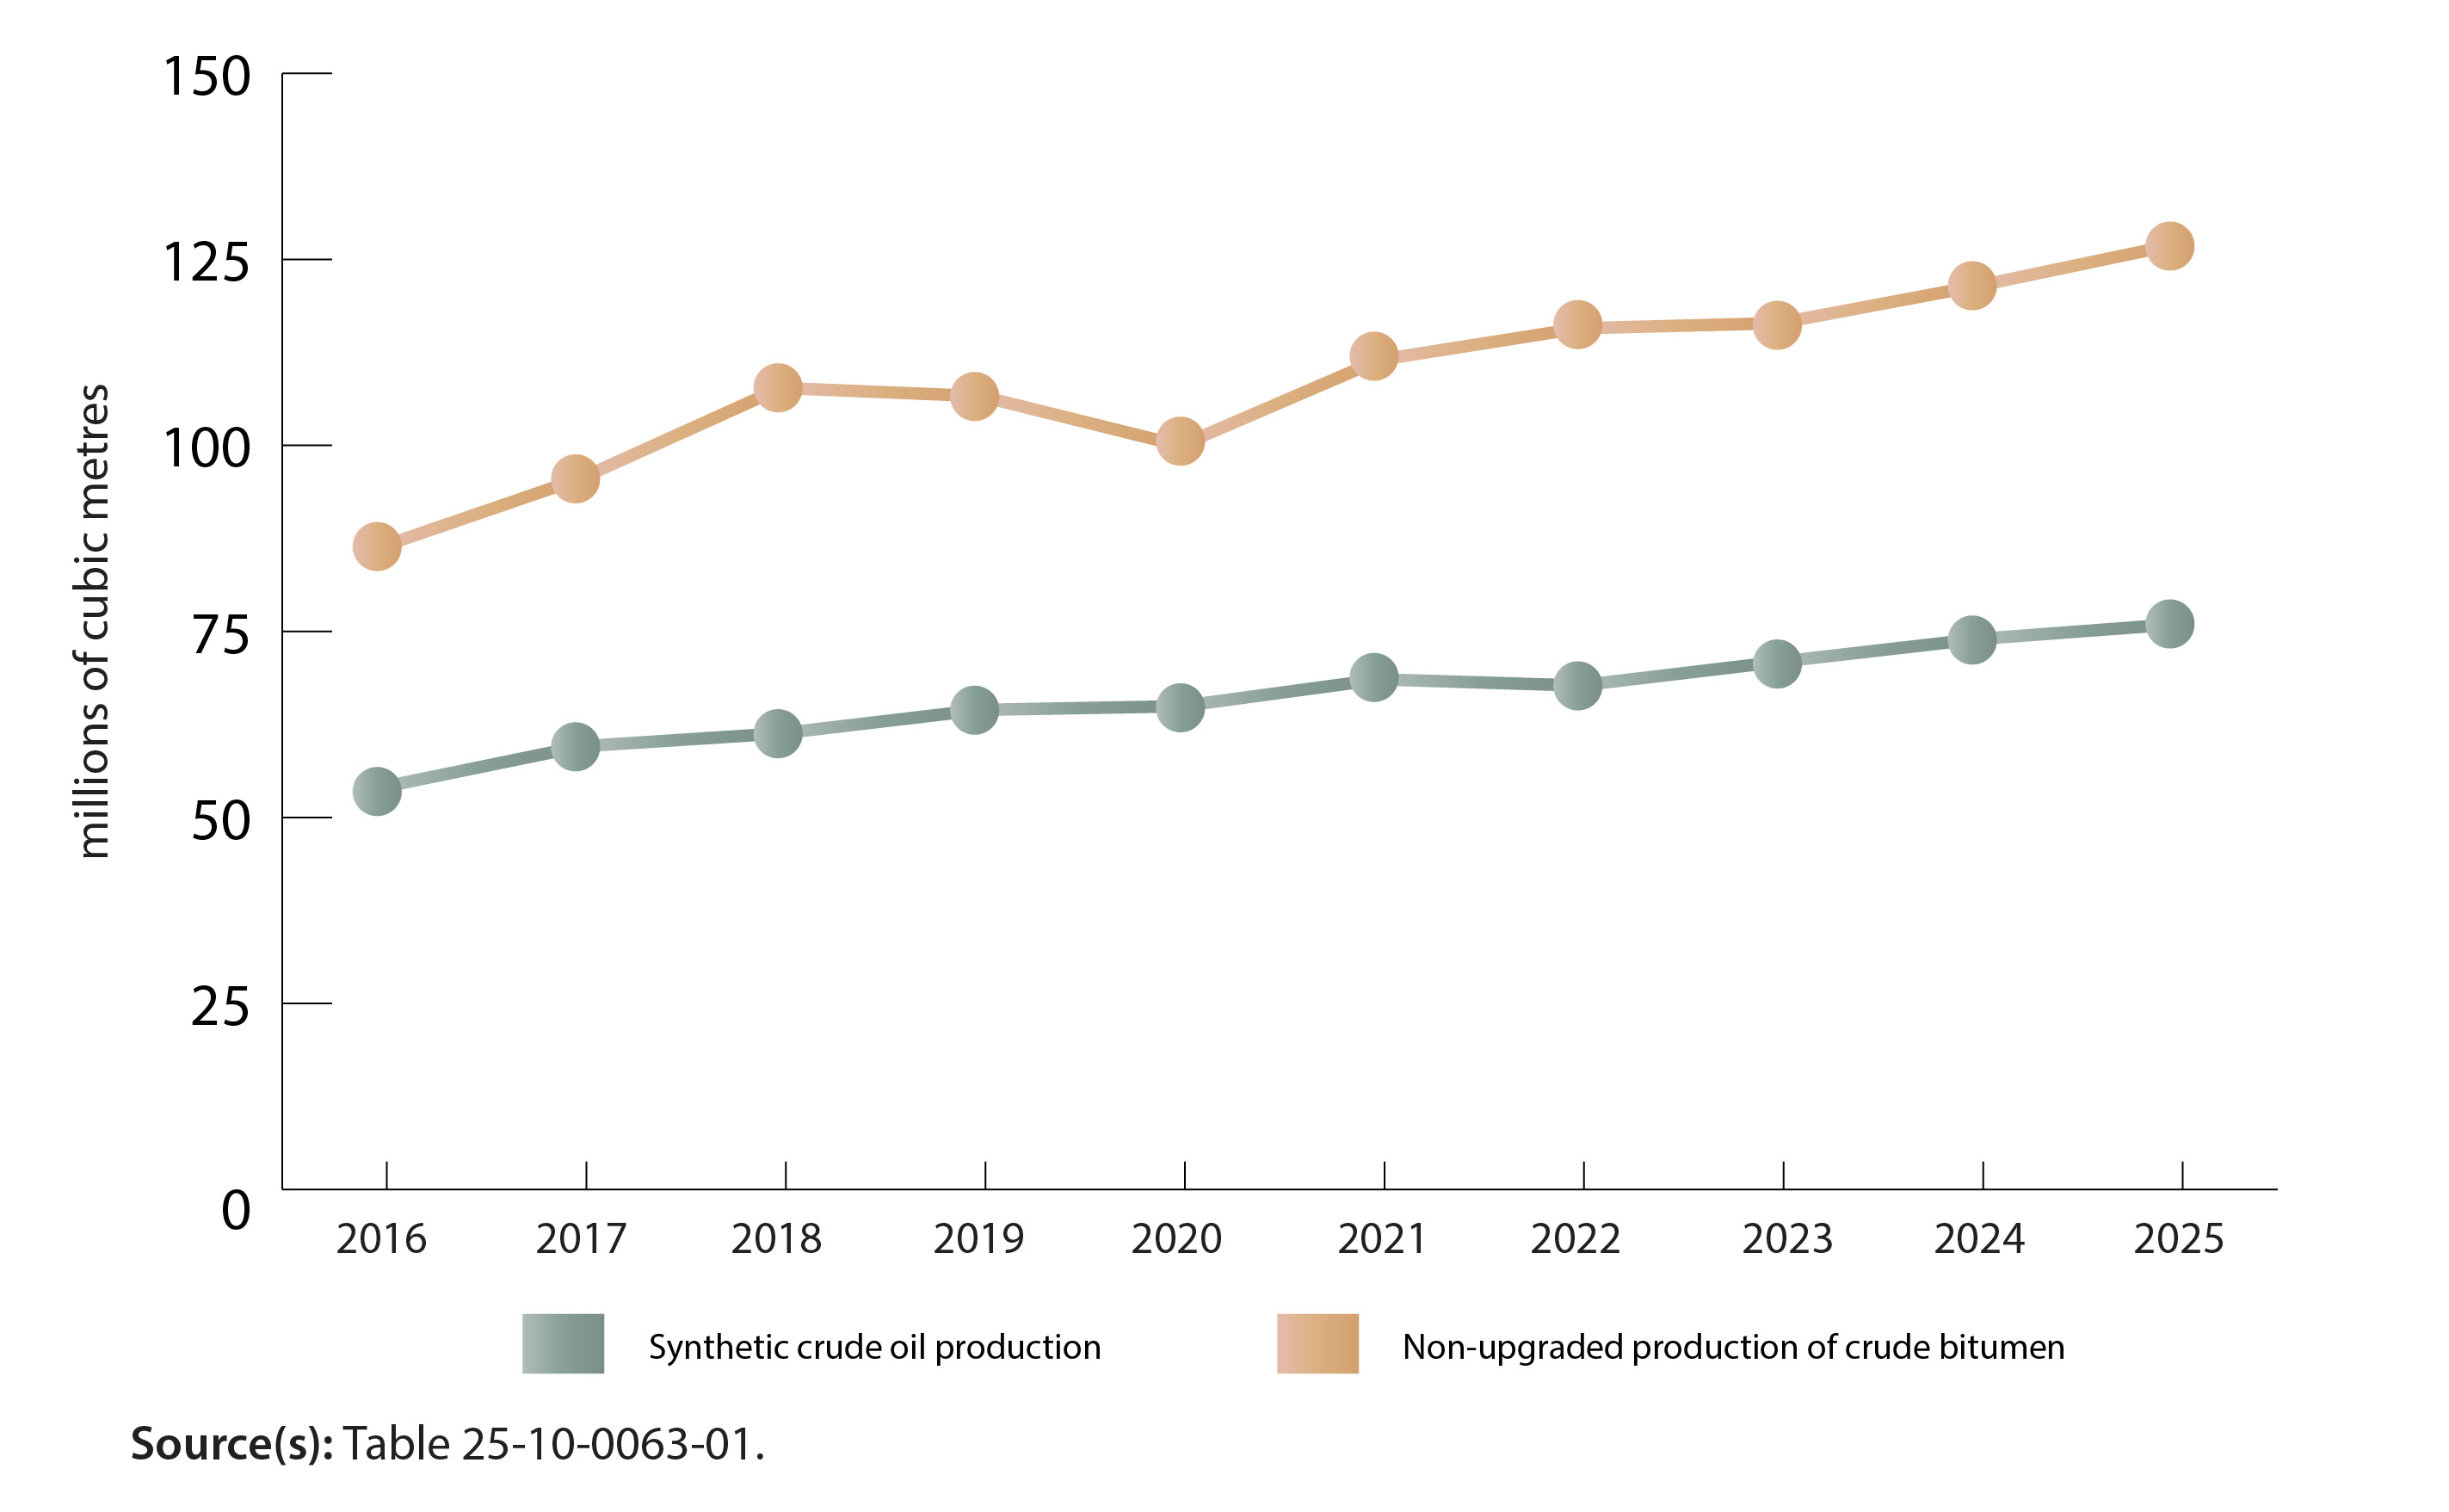
In 2025, crude oil from the Alberta oil sands continued to account for the highest share of nationwide production, rising 3.9% to 203.1 million cubic metres. Production of crude bitumen drove this increase, up by 4.6% to 127.1 million cubic metres. Following the fall maintenance period, monthly bitumen production reached 11.6 million cubic metres in December 2025, the highest monthly production on record.
Chart 1 - Alberta oil sands production
Description - Chart 1 - Alberta oil sands production
The title of this chart is “Alberta oil sands production.”
This chart shows annual crude oil production, measured in millions of cubic metres.
This is a line chart with two lines. One line represents non-upgraded production of crude bitumen, and the second line represents synthetic crude oil production.
The vertical axis represents the volume of production in millions of cubic metres, from 0 to 150 million cubic metres, by increments of 25.
The horizontal axis represents the years from 2016 to 2025, in chronological order from left to right.
In 2016, non-upgraded production of crude bitumen was 86,408,548 cubic metres, and synthetic crude oil production was 54,072,047 cubic metres.
In 2017, non-upgraded production of crude bitumen was 95,620,041 cubic metres, and synthetic crude oil production was 59,565,211 cubic metres.
In 2018, non-upgraded production of crude bitumen was 107,724,326 cubic metres, and synthetic crude oil production was 61,299,373 cubic metres.
In 2019, non-upgraded production of crude bitumen was 106,624,367 cubic metres, and synthetic crude oil production was 64,459,875 cubic metres.
In 2020, non-upgraded production of crude bitumen was 99,975,542 cubic metres, and synthetic crude oil production was 64,941,790 cubic metres.
In 2021, non-upgraded production of crude bitumen was 111,510,081 cubic metres, and synthetic crude oil production was 68,559,057 cubic metres.
In 2022, non-upgraded production of crude bitumen was 115,741,961 cubic metres, and synthetic crude oil production was 67,731,532 cubic metres.
In 2023, non-upgraded production of crude bitumen was 116,434,109 cubic metres, and synthetic crude oil production was 70,913,748 cubic metres.
In 2024, non-upgraded production of crude bitumen was 121,460,355 cubic metres, and synthetic crude oil production was 73,987,102 cubic metres.
In 2025, non-upgraded production of crude bitumen was 127,065,017 cubic metres, and synthetic crude oil production was 75,987,507 cubic metres.
Source(s): Table 25-10-0063-01.
Similarly, synthetic crude oil production rose 2.7% to 76.0 million cubic metres in 2025, reaching a monthly record high of 7.1 million cubic metres in November, following fall maintenance at some upgraders. Production of equivalent products (condensate and pentanes plus)—used as diluents to facilitate crude bitumen transportation via pipelines—also reached record high production in 2025. It rose 7.2% to 32.9 million cubic metres, though this was a slower pace than in 2024 (+10.3%).
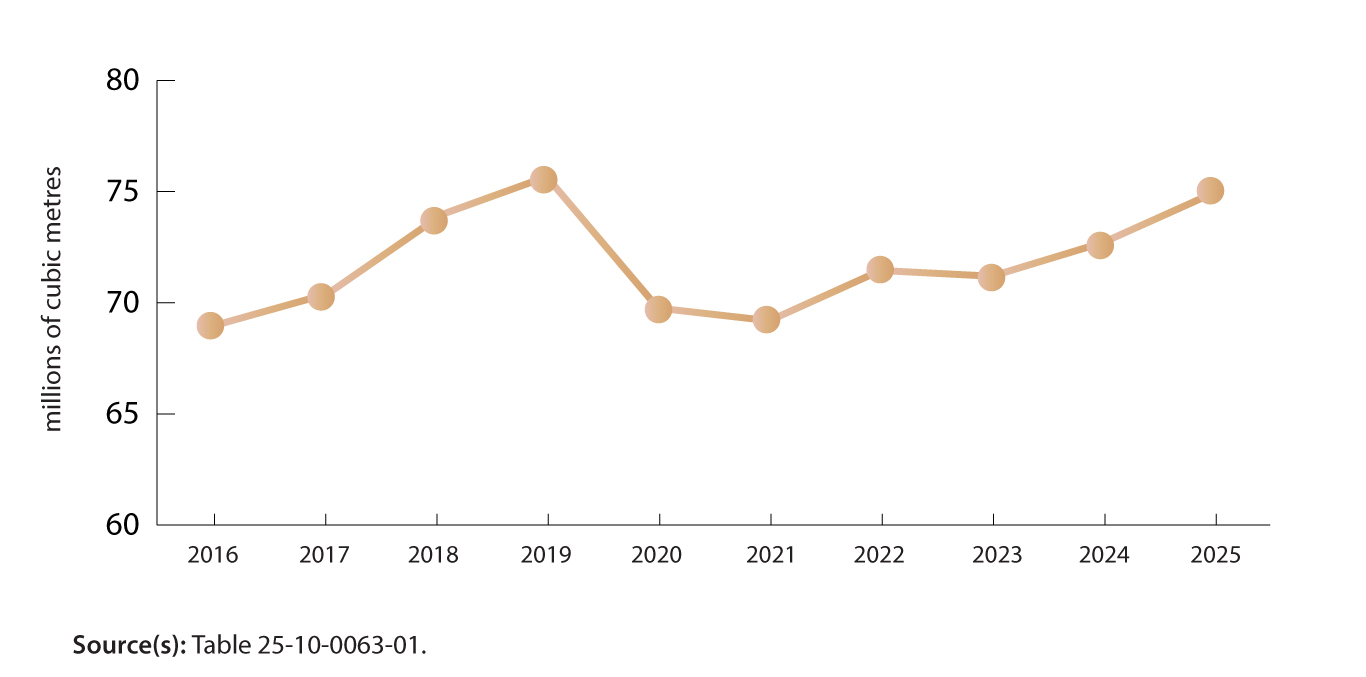
Oil extraction (excluding oil sands) also contributed to the overall increase in production of crude oil and equivalent products, rising 3.1% to 75.0 million cubic metres in 2025, although this was just shy of its 2019 peak (75.7 million cubic metres). The growth was driven by light and medium crude oil (+4.8%), while production of heavy crude edged up 0.1% to 26.4 million cubic metres, narrowly surpassing the previous record-high volumes observed in 2024.
Chart 2 – Crude oil extraction (excluding oil sands), Canada
Description - Chart 2 – Crude oil extraction (excluding oil sands), Canada
The title of this chart is “Crude oil extraction (excluding oil sands), Canada.”
This chart shows annual crude oil extraction, measured in millions of cubic metres.
This is a line chart, representing crude oil extraction.
The vertical axis represents the volume of crude oil extraction in millions of cubic metres, from 60 to 80 million cubic metres, by increments of 5.
The horizontal axis represents the years from 2016 to 2025, in chronological order from left to right.
In 2016, crude oil extraction was 69,000,562 cubic metres.
In 2017, crude oil extraction was 70,399,163 cubic metres.
In 2018, crude oil extraction was 73,866,912 cubic metres.
In 2019, crude oil extraction was 75,669,893 cubic metres.
In 2020, crude oil extraction was 69,760,550 cubic metres.
In 2021, crude oil extraction was 69,191,880 cubic metres.
In 2022, crude oil extraction was 71,451,549 cubic metres.
In 2023, crude oil extraction was 71,194,446 cubic metres.
In 2024, crude oil extraction was 72,711,898 cubic metres.
In 2025, crude oil extraction was 74,959,944 cubic metres.
Source(s): Table 25-10-0063-01.
The largest contribution to the increase in light and medium crude oil came from Newfoundland and Labrador, where offshore production totalled 13.9 million cubic metres, up 14.5% from 2024 and the largest year-over-year increase in the current data series. In 2025, the White Rose and North Amethyst oil fields resumed operations, with the return of the SeaRose Floating Production, Storage and Offloading vessel, which had been out for maintenance since January 2024. Further expansion of the White Rose oil field is expected in 2026, with a new platform set to begin operations in the second half of the year.
Exports to countries other than the United States drive growth
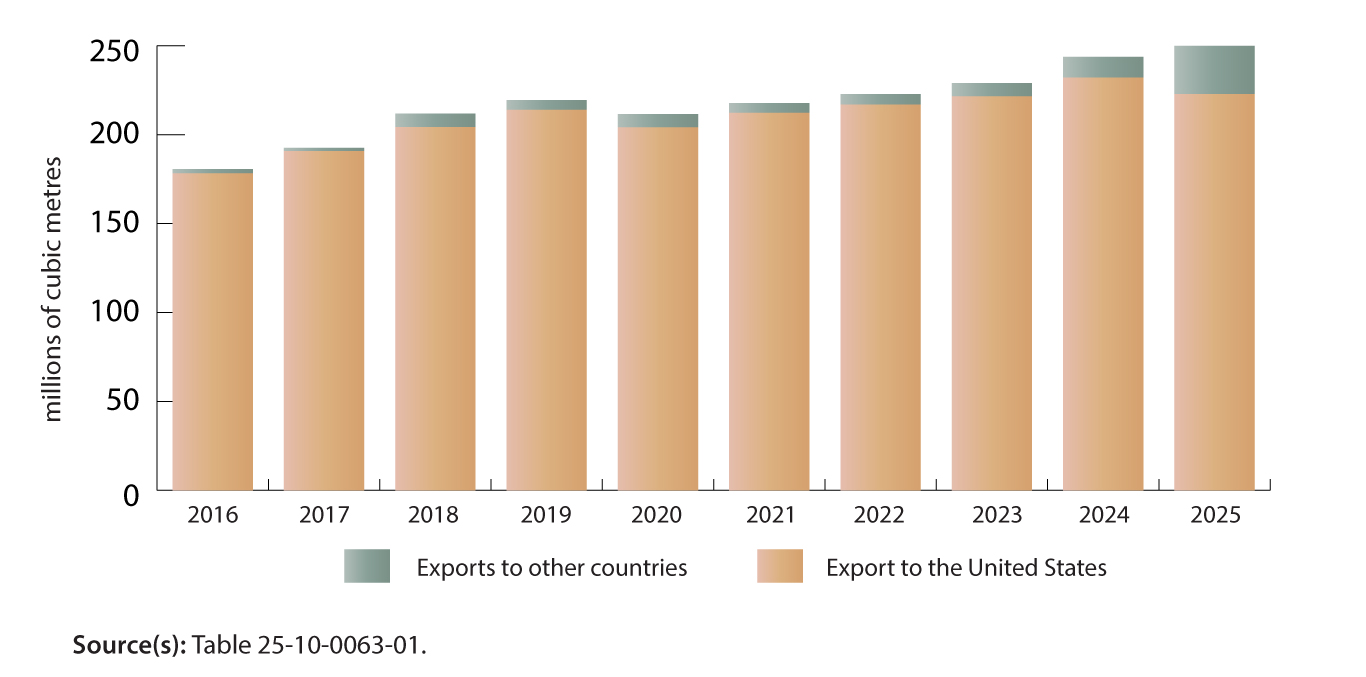
Exports of crude oil and equivalent products rose for the fifth consecutive year in 2025, increasing 2.5% to a new record of 249.9 million cubic metres. This was mostly due to the Trans Mountain pipeline expansion and a shift in destinations for some exports. For the first time since the start of the series, the overall increase was driven by exports to countries other than the United States, up 132.6% to 27.2 million cubic metres.
Exports to the United States fell 4.0% to 222.7 million cubic metres in 2025, the first year-over-year decrease since 2020. While most Canadian crude oil exports continued to flow to the United States by pipeline (82.1%) in 2025, increased shipments through British Columbia and Newfoundland and Labrador have opened new foreign markets. Overall, just over one-tenth (10.9%) of exports were destined for countries other than the United States, more than triple the average share from the 2016-to-2024 period (2.8%).
Chart 3 – Crude oil exports, by destination
Description - Chart 3 – Crude oil exports, by destination
The title of this chart is “Crude oil exports, by destination.”
This is a vertical bar chart.
The vertical axis represents the volume of crude oil exports in millions of cubic metres, from 0 to 250 million cubic metres, by increments of 50.
The horizontal axis shows the years from 2016 to 2025, in chronological order from left to right.
There is one bar for each year. Each bar is a stacked bar with two values. The bottom value represents exports to the United States, and the top value represents exports to other countries.
In 2016, exports to the United States were 178,269,568 cubic metres, and exports to other countries were 2,342,269 cubic metres.
In 2017, exports to the United States were 190,752,648 cubic metres, and exports to other countries were 1,789,555 cubic metres.
In 2018, exports to the United States were 204,296,159 cubic metres, and exports to other countries were 7,576,650 cubic metres.
In 2019, exports to the United States were 213,890,915 cubic metres, and exports to other countries were 5,495,525 cubic metres.
In 2020, exports to the United States were 204,075,306 cubic metres, and exports to other countries were 7,433,013 cubic metres.
In 2021, exports to the United States were 212,306,599 cubic metres, and exports to other countries were 5,356,233 cubic metres.
In 2022, exports to the United States were 216,948,002 cubic metres, and exports to other countries were 5,904,707 cubic metres.
In 2023, exports to the United States were 221,582,584 cubic metres, and exports to other countries were 7,337,930 cubic metres.
In 2024, exports to the United States were 232,019,661 cubic metres, and exports to other countries were 11,692,961 cubic metres.
In 2025, exports to the United States were 222,724,380 cubic metres, and exports to other countries were 27,199,685 cubic metres.
Source(s): Table 25-10-0063-01.
The year 2025 was another record year for Canadian crude oil, with record production and expanded export capacity on both coasts, giving greater access to Canada’s trade partners worldwide.
For more information about new crude oil export destinations following the expansion of the Trans Mountain pipeline, see: The Trans Mountain pipeline is delivering.
For more information on energy in Canada, including production, consumption, international trade and much more, visit the Canadian Centre for Energy Information portal and follow #EnergyNews on social media.
Other energy 2025 year-in-review articles
- Another record year of production for refined petroleum in 2025 - Statistics Canada (April 14, 2026)
- Natural gas in 2025: Record production, rising consumption and expanding exports (April 8, 2026)
- Electricity generation from combustibles and renewables sharply increase amid another dry year: Electricity year in review 2025 (March 31, 2026)
Correction
On June 25, 2026, a correction was made to the legend in the first chart, to properly match the corresponding lines. The data in the chart were not affected.
Contact information
For more information, contact the Statistical Information Service (toll-free 1-800-263-1136; 514-283-8300; infostats@statcan.gc.ca) or Media Relations (statcan.mediahotline-ligneinfomedias.statcan@statcan.gc.ca).