Canadian Statistical Geospatial Explorer, July 2020 (update)
Archived Content
Information identified as archived is provided for reference, research or recordkeeping purposes. It is not subject to the Government of Canada Web Standards and has not been altered or updated since it was archived. Please "contact us" to request a format other than those available.
Released: 2020-07-31
New datasets are now available in the Canadian Statistical Geospatial Explorer
Launched in April 2020, the Canadian Statistical Geospatial Explorer (CSGE) is an interactive web mapping tool that gives users the ability to explore, create custom maps and download geo-enabled data to power their own geospatial analytics. New datasets on underlying health conditions and COVID-19, neighbourhood income, and proximity to public transportation have now been added to other datasets on health indicators, Census of Population and communities, making the CSGE an even more valuable tool to inform decision-making.
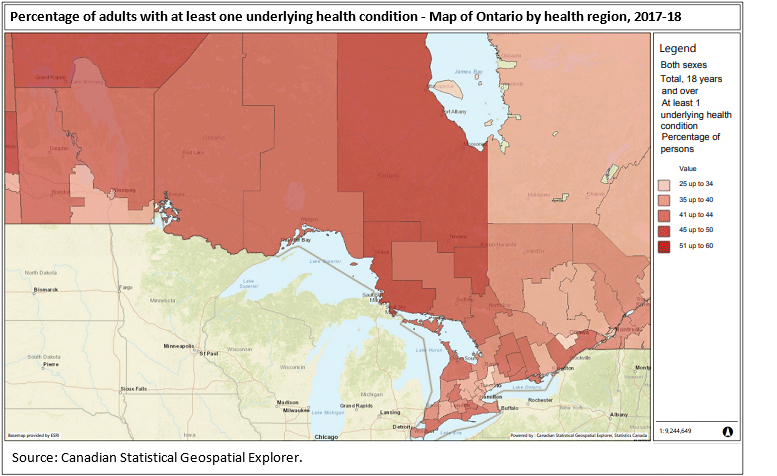
Measuring the prevalence of underlying health conditions that increase the risk of severe health outcomes related to COVID-19
As the COVID-19 pandemic has spread, researchers and health professionals have noted large differences in the impact that the infection has on individuals. Whereas some remain asymptomatic and unaware of their infection or experience only mild symptoms, others require hospitalization, ventilation, and may even die. To better understand which segments of the Canadian population may be vulnerable to severe health outcomes related to COVID-19, Statistics Canada and the Public Health Agency of Canada have worked collaboratively to build an index of underlying health conditions in the adult household population. Analysis of this dataset showed that 37.8% of Canadian adults (age 18 and older) living in private households reported having one or more underlying health condition that could put them at elevated risk of complications following COVID-19 infection. In Ontario, the proportion of adults with one or more underlying health condition varied by health region, ranging from 30.4% to 53.0%.
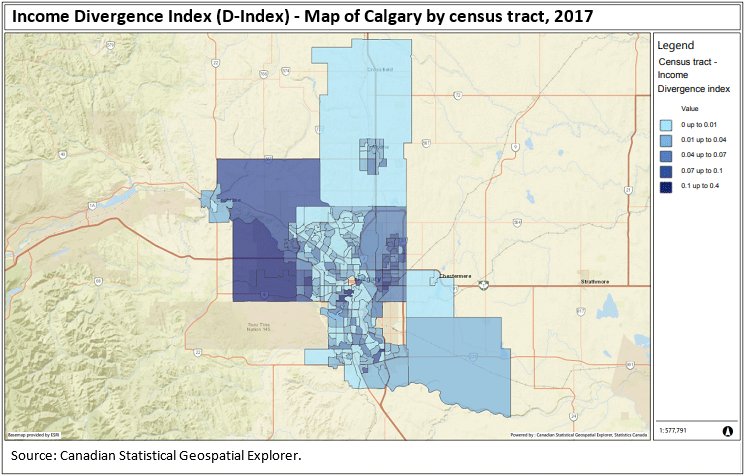
Family income mixing by neighbourhood
The income divergence index (D-index) developed in partnership with Canada Mortgage and Housing Corporation measures the degree to which families of varying income levels are represented in neighbourhoods defined using census tracts (CTs). Analysts can use the index to examine whether the income mix of a neighbourhood is associated with outcomes such as residents' neighbourhood satisfaction or where to locate new investments in social and affordable housing. The D-index ranges from a value of 0, indicating the income mix of families in the CT matches that of its census metropolitan area (CMA), to a value of 1, where the incomes of all families in the CT are concentrated in one part of the income distribution. In Calgary, the D-index ranges from 0 to near 0.2, with the most income-mixed neighbourhoods tending to be more centrally located.
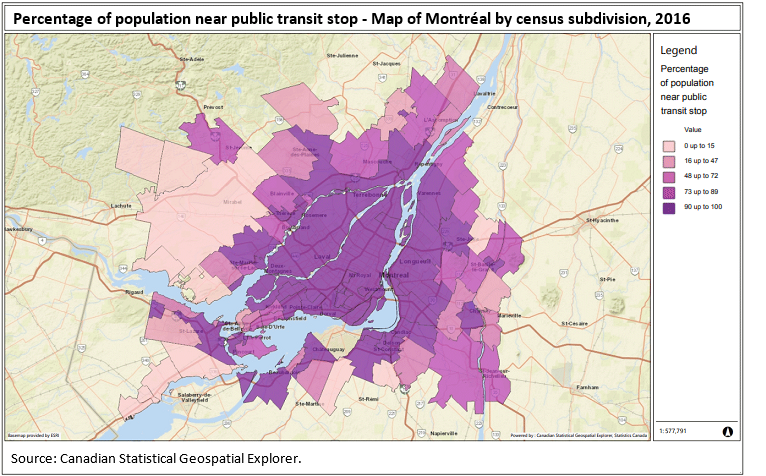
Sustainable development goal: Convenient access to public transport
The proximity to public transportation for Canada's 35 CMAs measures Canadians' convenient access to public transportation, one of the United Nations' sustainable development goals. The percentage of the population living within 500 metres of public transit ranged from 49% in Saint John, New Brunswick to 90% in Canada's three largest CMAs (Toronto, Montréal and Vancouver).
Providing user support
The CSGE hub includes tutorials to help our users take full advantage of all the features of this interactive tool. These easy-to-follow tutorials are provided to help users select the data they need, create and export custom maps, and export data to Excel or to a shapefile. Examples are provided to show what is possible with the tool.
Note to readers
Other datasets that have been recently added in the Canadian Statistical Geospatial Explorer include Census of Population data for different geographic levels, such as health regions and economic regions, and population in nursing homes and/or residences for senior citizens by broad age groups and sex.
The data on The prevalence of underlying health conditions that increase the risk of severe health outcomes related to COVID-19 were based on adult (age 18 years and older) respondents to the 2017/2018 Canadian Community Health Survey. The most common conditions of individuals who were hospitalized or who died due to COVID-19 infection are: chronic obstructive pulmonary disease, obesity, high blood pressure, currently having cancer, heart disease, suffering from the effect of a stroke, diabetes, or dementia.
The Income divergence index (D-index) by census tract compares neighbourhood discrete income distributions to a base distribution (income quintiles of the neighbourhood's census metropolitan area) to describe the level of neighbourhood income mixing.
The percentage of Canadians living within 500 metres of a public transport access point is available at Proximity to public transportation in Canada's metropolitan areas.
Products
An updated Canadian Statistical Geospatial Explorer Hub, which is part of the series Statistics Canada – Data Visualization Products (71-607-X), is now available.
Contact information
For more information, or to enquire about the concepts, methods or data quality of this release, contact us (toll-free 1-800-263-1136; 514-283-8300; STATCAN.infostats-infostats.STATCAN@canada.ca) or Media Relations (613-951-4636; STATCAN.mediahotline-ligneinfomedias.STATCAN@canada.ca).
- Date modified:


