
5 Data Visualization
5.9 Answers
Text begins
Topic navigation
-
-
Return to question 1a
Table 5.9.1
Number of basketball games attended by 50 season ticket holders
Table summary
This table displays the results of Number of basketball games attended by 50 season ticket holders. The information is grouped by Number of matches (x) (appearing as row headers), Frequency (f), Percentage (%), Cumulative Frequency and Cumulative Percentage (%) (appearing as column headers).Number of matches (x) Frequency (f) Percentage (%) Cumulative Frequency Cumulative Percentage (%) 10 2 4 2 4 11 4 8 6 12 12 4 8 10 20 13 5 10 15 30 14 6 12 21 42 15 10 20 31 62 16 8 16 39 78 17 7 14 46 92 18 3 6 49 98 19 1 2 50 100 TOTAL 50 100 Note ...: not applicable Note ...: not applicable ... not applicable -
 Return to question 1b
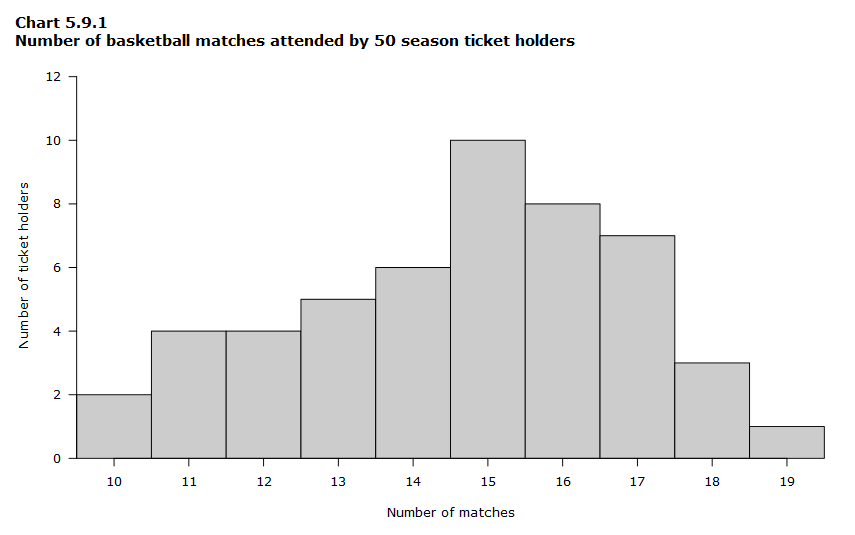
Data table for Chart 5.9.1
Data table for Chart 5.9.1
Table summary
This table displays the results of Data table for Chart 5.9.1. The information is grouped by Number of matches (appearing as row headers), Tally (frequency) (appearing as column headers).Number of matches Tally (frequency) 10 2 11 4 12 4 13 5 14 6 15 10 16 8 17 7 18 3 19 1 - The five-number summary is
- Minimum: 10
- Lower quartile: 13
- Median: 15
- Upper quartile: 16
- Maximum: 19
Return to question 1c
-
- Date modified: