Delivering trusted, modern statistics for Canadians

For over a century, Statistics Canada (StatCan) has been committed to providing high-quality, insightful, and accessible data to help Canadians better understand their country. Trust is the core currency of official statistics. In an era characterized by a rapid expansion of data sources and an insatiable thirst for information, we continually anchor our work in strict professional standards, transparency, and accountability. 

At the same time, producing official statistics has become increasingly complex. Canada's economy and society are evolving rapidly, shaped by globalization, technological change, new business models, shifting demographics, climate-related events, and the growing digital economy. Canadians expect statistics that are more timely, detailed, connected, and cost-effective—all while maintaining the highest standards of quality and trust. Meeting these expectations requires continual innovation in how official statistics are produced, without compromising the professional principles that underpin them.

Recent discussions have highlighted the universal challenges national statistical agencies face—including an increasingly complex information environment shaped by misinformation and disinformation, evolving public engagement, changing survey response dynamics, and the need to operate efficiently within current fiscal realities. We hear these perspectives and are proactively reshaping how we gather, guard, and grow our data systems to meet the expectations of Canadians today and into the future. 

Addressing changing response rates: The shift to a modern collection ecosystem

Traditional survey response rates have experienced a global downward trend over the past few decades, driving a strategic shift in how we build a more resilient statistical ecosystem. 

To maintain the high accuracy and representation that Canadians rely on, we are implementing a multi-faceted approach: 

  • An "administrative data first" approach: To reduce response burden on households and businesses, we are increasingly leveraging existing secure administrative and alternative data sources, such as tax data, municipal rolls, and land registries. By integrating these sources into our statistical programs, we can often substitute or supplement traditional survey questions. For example, household income information that was once collected directly through surveys is now largely obtained from administrative data files provided by the Canada Revenue Agency. This improves data quality while reducing the number of questions Canadians are asked to answer.
  • Responsive and sustainable collection: We are incorporating behavioural science and active monthly live testing into major programs like the Labour Force Survey (LFS). By better understanding our respondents, optimizing our digital communications, and focusing follow-up efforts on under-represented units, we are actively modernizing operations to keep our landmark surveys strong. 
  • Advanced non-response treatments: StatCan utilizes cutting-edge mathematical models and external validation data to protect against non-response bias. This ensures that even with smaller sample sizes or shifting response dynamics, the final data outputs remain robust, representative, and highly granular. 
  • Responsible AI and machine learning: To improve efficiency, enhance quality, and respond to emerging information needs, we are responsibly integrating artificial intelligence (AI) and machine learning into statistical production and analysis. Through human oversight, transparent methods, bias mitigation, and strong governance, these tools uphold the principles of official statistics while helping maintain the public trust that underpins our work.

Clarifying revisions: Precision in a fast-moving economy

In a fast-moving economy, delivering information when it matters most requires a careful balance between timeliness and ultimate completeness. StatCan publishes initial estimates using the highest-quality data available at that moment. As more complete information flows in over subsequent months—such as corporate tax updates, comprehensive trade summaries, or late survey responses—we refine those numbers. This standard methodology ensures that policymakers, businesses, and the public are equipped with immediate insights first, while valuable information received afterwards is incorporated to yield the most complete and accurate historical record possible. 

A key element of modern statistical science is the standard practice of data revisions. Revisions are not a sign of initial error; they reflect a commitment to timeliness, precision, transparency, and producing the best possible evidence. Today's economy is more dynamic and interconnected than ever, making the measurement of economic activity and unexpected economic shocks increasingly complex. As additional information becomes available, revisions ensure that Canada's economic statistics continue to reflect the most accurate picture of the economy.

Guarding privacy and fostering transparency

We recognize that the willingness of Canadians to participate in our data collection relies entirely on their confidence in our privacy frameworks. Through the Statistics Canada Trust Centre, we make our data governance visible. Every project we undertake is strictly evaluated against the pillars of legal authority, necessity, proportionality, and ethics. 

Whether we are deploying advanced machine learning tools or integrating complex datasets, we mask, anonymize, and de-identify personal data to guarantee that individual privacy is never compromised. 

Keeping standards and measurement frameworks current

Producing relevant official statistics also requires continually updating the standards and measurement frameworks that underpin them. As Canada's economy and society evolve, so too must the concepts, classifications, and statistical frameworks used to measure them. Emerging technologies, new forms of work, digital commerce, globalization, and changing social realities require ongoing methodological review to ensure that official statistics remain meaningful, internationally comparable, and reflective of Canadians' lived experiences. By regularly modernizing these foundational standards, StatCan ensures that the data used by governments, businesses, researchers, and Canadians continues to accurately represent the country we measure.

Looking to the future

Maintaining the relevance of official statistics requires continual improvement. As outlined in our 2026-27 Departmental Plan, we are working to deliver a fuller, more connected picture of Canada with significantly less response burden. By modernizing and standardizing key processes, expanding the use of integrated data sources, and preparing our data and technology environment to support advanced analytics and AI, we are ensuring that Canadian data remains a global standard for trustworthiness and public good. 

Monthly Survey of Food Services and Drinking Places: CVs for Total Sales by Geography - June 2026

CVs for Total sales by geography
GeographyMonth
202506202507202508202509202510202511202512202601202602202603202604202605202606
percentage
Canada0.050.050.060.060.080.070.090.120.10.080.110.140.12
Newfoundland and Labrador0.260.20.20.280.310.320.450.530.460.440.660.870.67
Prince Edward Island0.390.40.340.450.591.171.171.71.441.021.354.820.76
Nova Scotia0.20.170.190.240.250.60.430.380.360.720.570.620.43
New Brunswick0.240.190.210.350.390.820.360.470.410.970.570.60.42
Quebec0.080.080.170.150.270.170.180.280.240.20.240.280.23
Ontario0.090.070.090.10.130.120.160.20.160.130.190.230.22
Manitoba0.240.230.220.340.370.590.520.690.610.690.70.70.48
Saskatchewan0.390.540.260.40.350.690.460.531.110.690.780.990.47
Alberta0.150.190.160.160.170.20.230.320.210.220.380.370.31
British Columbia0.10.160.120.120.130.170.190.250.20.20.230.290.29
Yukon Territory0.911.031.071.321.642.062.182.842.742.433.072.952.88
Northwest Territories2.511.181.291.171.292.172.342.842.62.3312.262.872.77
Nunavut2.142.6747.682.722.464.641.92.852.593.363.543.63.14

Visitor Travel Survey: AES Calibration Groups - Q1 2026

Table 1
AES Calibration Groups for American Visitors
Calibration groupsNumber of groups
Region/Province of entry by duration of stay18
Table 2
AES Calibration Groups for Overseas Visitors
Calibration groupsNumber of groups
Country of residence 24
Country of residence by duration48
Region by duration10

Eh Sayers Episode 34 - A Honeybee Trivia Showdown

Release date: August 19, 2026

Catalogue number: 45-20-0003
ISSN: 2816-2250

Eh Sayers Episode 34 - A Honeybee Trivia Showdown

Listen to "Eh Sayers" on:

Think your honeybee knowledge is as sweet as honey? Test it in this Eh Sayers trivia showdown. Discover honey production, beekeeper numbers, colony counts and the vital role bees play in our food supply.

Host

Max Zimmerman

Guests

Jacqueline Luffman, Marc Lemire, Vince Germano

Listen to audio

Eh Sayers Episode 34 - A Honeybee Trivia Showdown - Transcript

Max: Welcome to a special summer edition of Eh Sayers Trivia. Today, I've forced three of my colleagues to come compete against each other in a series of skill testing questions. Today's theme, bees. The rules are simple. I'll ask them all four questions worth one point each and one bonus question worth three points.

Whoever has the most points at the end of the show wins. What's the prize for the winner, you might ask? Absolutely nothing, except... No, really, nothing. The studio's buzzing, so grab your honey and get ready to see who comes out on top as our queen bee. Without further ado, let's meet our contestants

Jackie: I'm Jacqueline Luffman.

I am chief of publishing services and dissemination division. I've been here 29 years.

Marc: My name is Marc Lemire. I am chief of corporate communications here at Statistics Canada.

Max: All right. Welcome to the winner of the inaugural Christmas tree trivia episode of Eh Sayers. Who am I sitting in front of right now?

Please introduce yourself to all the folks for your victory lap.

Vince: I am Vince Germano, a communications officer at Statistics Canada.

Max: And how much do you know about bees and honey? On a scale of one to 10, where, where would you rank yourself?

Jackie: On a scale of one to 10, I would rank myself maybe a five.

Marc: Oh, my gosh.

Uh, let's, let's go middle of the pack to lower. So let's go with four. Four. Four.

Max: So like a seasoned bee expert.

Marc: Y- oh, yeah. Don't embarrass me. Well, I'll, I'll do my best. Thank goodness for multiple choice.

Max: Okay.

Vince: Mm. I would say probably like six

Max: All right, so we'll jump right into it here. Question number one, are you ready?

Jackie: Sure.

Vince: Yes, let's do it. I guess I just buzz in?

Max: That's... Oh, look at what he did there. Yes, sir. Okay. Number one, how many pounds of honey were produced in Canada in 2025? Multiple choice here: A, 43 million pounds of honey; B, 71 million pounds; C, 84 million pounds; or D, 117 million pounds.

Jackie: Well, this is, this is tough, and I don't know yet how many beekeepers there are or anything like that.

I like the middle. I'm gonna say 80 million pounds or whatever the 81 was.

Max: C, 84 million pounds.

Jackie: 84 million pounds. Final answer.

Max: Final answer.

Vince: Let's go with A. A, 43 million pounds, final answer?

Marc: Yes. Let's go with C, 84 million.

Max: C, 84 million, final answer?

Marc: Final answer.

Max: Correct. Yes, sir. You got it. 84 million pounds of honey was produced in Canada in 2025.

Well done.

Marc: I am off to a lucky start.

Jackie: I like middle. We're- That was my strategy.

Max: We're batting 1,000. Let's keep it up. Okay.

Jackie: All right.

Max: All right, moving on. Number two, so sales of honey rose 14.8% year over year in 2025. Ooh. What is the total dollar amount of honey sold in 2025? You got A, $241 million worth of honey; B, $356 million; C, $792 million; or D, $1.3 billion.

Vince: That's a lot of honey, some would say. Let's go with D.

Jackie: Ooh, okay. Well, if there was about 80 million pounds and generated... Well, that doesn't necessarily mean that all of it was sold, but I would imagine you have to at least... You know, it's gonna be over a dollar a pou- Well, maybe it'd be a dollar a pound. Eh, it could be more than that.

Max: I like where you're going with this.

Jackie: You see where I'm going, yeah?

Max: Absolutely. I- Yes.

I'm catching what you're putting down.

Jackie: Again, this is my reverse math here. Um, I think I'll go with B. Billion.

Marc: Wow. What was B again?

Max: B was $356 million.

Marc: That one sounds good to me.

Max: B. Locking it in?

Marc: Locking it in.

Max: The answer was A, $241 million.

Jackie: No.

Max: But that's close. Okay. You were in the ballpark. Oh, you

Jackie: know what? I was doing-

Max: Yeah. Oh, 100%. I- You were... I thought you were gonna get it bang on. Yeah. But not far off, so.

Jackie: I, I went a little high.

Max: Well- I

Marc: was, I was on the

Max: right side. Yeah, absolutely. Definitely. A

Marc: billion dollars in sales.

Max: That's- $1.3 billion is a lot.

Yeah. That's for sure.

Marc: Yeah.

Max: That's for sure.

Okay. Number three: In 2025- Mm-hmm ... the number of beekeepers in Canada rose 6.5% year over year to its highest level since the 1980s. The number of beekeepers in Canada in 2025 was almost double the number compared to a decade ago. The question is, how many beekeepers were there in Canada in 2025?

No multiple choice on this one.

Vince: Let's go with around 8,000.

Jackie: Oh, Lord. Um, y- I did read something about beekeepers recently, something we produced in th- at Stats Can.

Vince: Okay.

Jackie: So I thought there was actually, like, in the thousands. I thought it was, like, 20,000 maybe.

Marc: Okay, so it doubled from where it was in the '80s.

Max: No, it's reached its highest level since the 1980s.

Marc: Oh,

okay. Sorry.

Max: And it's doubled compared to a decade ago.

Marc: Right. Okay. Gotcha. Let's go with, uh, 15,000 beekeepers.

Max: Marc, are you a genius? Because the answer was 16,000- Really? ... 360 beekeepers.

Marc: That was a shot in the dark. I swear I did not study for this.

Max: All right, moving on.

So number four, there's two kinds of bees. There's honeybees and pollinator bees. 4/5 of all honey produced in Canada in 2025 came from the honeybees of the prairie provinces. Pollinator bees don't make as much honey, but they do make more money. So pollinator bees contribute billions of dollars annually to Canada's farm economy.

Bees are essential for pollinating many fruits and vegetables grown in Canada, including apples in Nova Scotia, blueberries in Quebec, veggies in Ontario, and cherries in British Columbia. All that being considered, almost 2/3, 64.5%, of beekeepers in Canada in 2025 were located in this province: A, Ontario, B, British Columbia, C, Quebec, D, Saskatchewan, or E, Manitoba.

Jackie: Well, even though I am originally from Winnipeg, I'm not gonna say Manitoba 'cause I don't think that's the answer. Okay. I'm gonna guess it, because it's the biggest province, Ontario.

Marc: I'm gonna go Quebec.

Max: C, Quebec, finally.

Marc: C, quebec, final answer.

Vince: Uh, let's go with D, Saskatchewan.

Max: D, Saskatchewan. The answer was B, British Columbia.

Jackie: Oh.

Vince: What?

Max: Yeah.

Jackie: Interesting.

Max: Yeah.

Jackie: Okay.

Max: Caught me off guard as well.

Jackie: But it sort of makes sense for pollinator bees, doesn't it?

Max: That's right.

So the bonus, are you ready?

Jackie: Yeah.

Max: This is the big one.

Jackie: Okay.

Max: Not for all the marbles, but for a lot of the marbles.

Jackie: Okay.

Max: All right. According to StatCan's Food Availability release-

Jackie: Mm-hmm

Max: which estimates the amount of food physically present in the country for consumption, how many kilograms of honey were available per Canadian in 2023? No multiple choice.

Jackie: Per person, okay. So our population is around 41 million.

Max: Mm-hmm.

Jackie: I would say we produced, if I recall, you said we produced lot of pounds of honey there.

So I'm going to say, kilograms you want?

Max: Kilograms of honey per person.

Jackie: I would say like two kilograms per person.

Vince: Kilograms?

Max: Mm-hmm.

Vince: I have no idea.

Max: Got to guess. Take your time.

Vince: 1,800 kilograms.

Max: 1,800 kilograms per person.

Vince: Let's just go with that.

Max: The answer is just over one kilogram per Canadian.

Vince: Oh, really?

Jackie: Really?

Max: Yeah. Great answer.

Jackie: Well, that's awesome.

Marc: Okay, now let's not have that go to air then.

Max: No, good try. Good try. 25, I mean, you're, you're in the ballpark still. I mean...

Marc: I just, I figured, yeah, I figured it would produce a lot more.

Max: Congratulations to my and your queen bee, Jacquie Luffman.

Jackie: Okay. There. That's awesome.

I do make a mean honey cake.

Max: Okay. Well...

Jackie: Yes. And you use about, you know, a full cup and a half of honey.

Max: I need to try this cake then.

Jackie: Yes. Okay. Yes. I have a very good recipe if you ever need it, so.

Max: You've been listening to Eh Sayers. Thank you to our guests Jacquie Luffman, Vince Germano and Mark Lemire. You can find this show wherever you get your podcasts. There, you can also find a French version of our show called Écoutez bien. If you like this show, please rate, review and subscribe. And as always, thanks for listening.

Statistics Canada's 2025–26 Departmental Results Report
Statistics Canada's Financial Statements, March 31, 2026

Statement of Management Responsibility Including Internal Control over Financial Reporting

Responsibility for the integrity and objectivity of the accompanying financial statements for the year ended March 31, 2026, and all information contained in these financial statements rests with the management of Statistics Canada. These financial statements have been prepared by management using the Government of Canada's accounting policies, which are based on Canadian public sector accounting standards.

Management is responsible for the integrity and objectivity of the information in these financial statements. Some of the information in the financial statements is based on management's best estimates and judgment and gives due consideration to materiality. To fulfill its accounting and reporting responsibilities, management maintains a set of accounts that provides a centralized record of the agency's financial transactions. Financial information submitted in the preparation of the Public Accounts of Canada, and included in the agency's Departmental Results Report, is consistent with these financial statements.

Management is also responsible for maintaining an effective system of internal control over financial reporting (ICFR) designed to provide reasonable assurance that financial information is reliable, that assets are safeguarded, and that transactions are properly authorized and recorded in accordance with the Financial Administration Act and other applicable legislation, regulations, authorities, and policies.

Management seeks to ensure the objectivity and integrity of data in its financial statements through careful selection, training and development of qualified staff; through organizational arrangements that provide appropriate divisions of responsibility; through communication programs aimed at ensuring that regulations, policies, standards, and managerial authorities are understood throughout the agency and through conducting an annual risk-based assessment of the effectiveness of the system of ICFR.

The system of ICFR is designed to mitigate risks to a reasonable level based on an ongoing process to identify key risks, to assess the effectiveness of associated key controls, and to make any necessary adjustments.

A risk-based assessment of the system of ICFR for the year ended March 31, 2026, was completed in accordance with the Treasury Board Policy on Financial Management and the results and action plans are summarized in the annex, which can be found at the end of the notes to these financial statements.

The effectiveness and adequacy of the agency's system of internal control is reviewed by the work of internal finance staff, who conduct periodic assessments of different areas of the agency's operations, and by the Departmental Audit Committee (DAC), who provide advice to the Chief Statistician on the adequacy and effectiveness of the agency's risk management, control and governance frameworks and processes.

The financial statements of Statistics Canada have not been audited.

Original copy signed by:

André Loranger
Chief Statistician

Ottawa, Canada
September 15, 2026

Martin Chapman
Chief Financial Officer

Ottawa, Canada
September 15, 2026

Statement of Financial Position (Unaudited)
As at March 31
(in thousands of dollars)
 

2026

2025

Liabilities

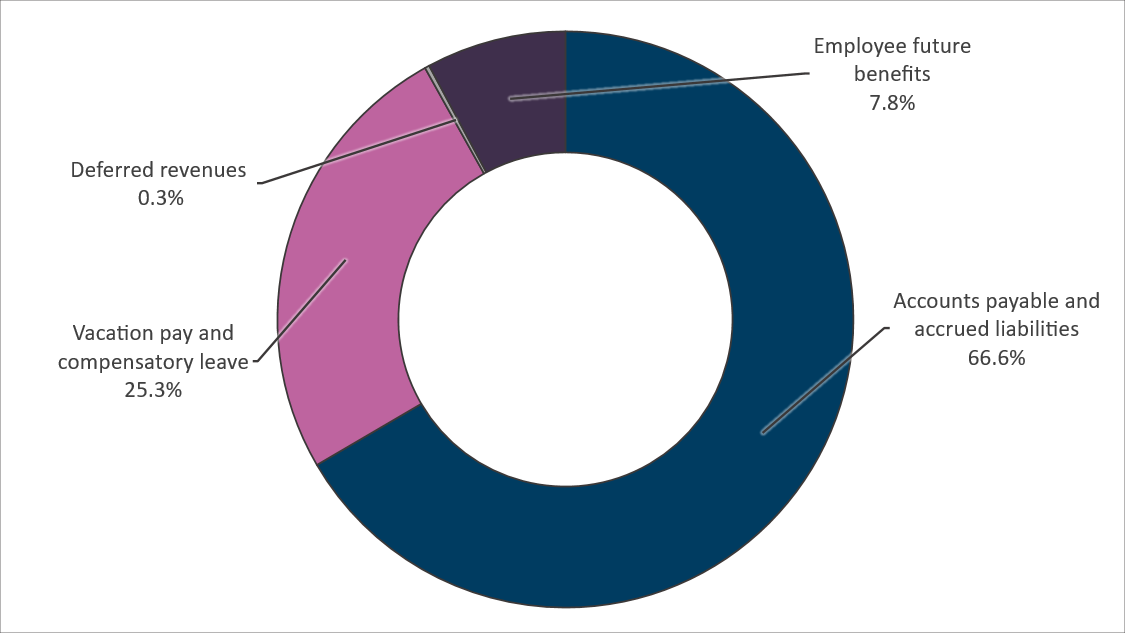
Accounts payable and accrued liabilities (note 4)

109,257

85,590

Vacation pay and compensatory leave

41,547

47,610

Deferred revenue (note 6)

424

0

Employee future benefits (note 7)

12,880

13,916

Total net liabilities

164,108

147,116

Financial assets

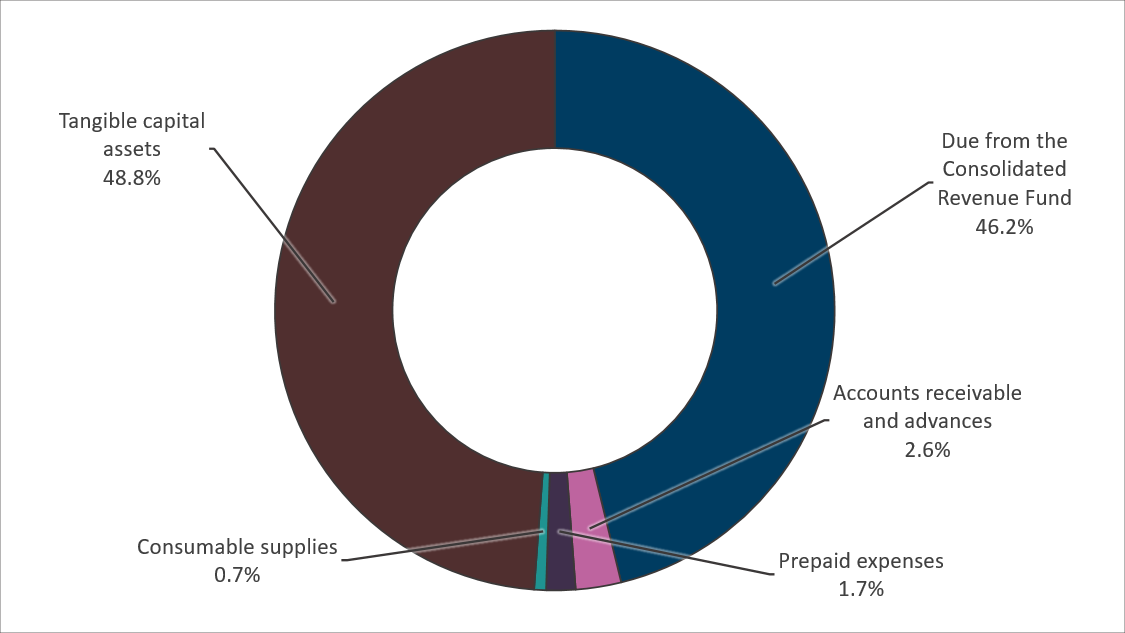
Due from Consolidated Revenue Fund

105,848

68,878

Accounts receivable and advances (note 8)

10,576

10,357

Total gross financial assets

116,424

79,235

Financial assets held on behalf of Government

Accounts receivable and advances (note 8)

(4,558)

(3,473)

Total financial assets held on behalf of Government

(4,558)

(3,473)

Total net financial assets

111,866

75,762

Departmental net debt

52,242

71,354

Non-financial assets

Prepaid expenses

3,860

7,918

Consumable supplies

1,568

1,479

Tangible capital assets (note 9)

111,883

122,257

Total non-financial assets

117,311

131,654

Departmental net financial position

65,069

60,300

Contractual obligations and contractual rights (note 10)

The accompanying notes form an integral part of these financial statements.

Original copy signed by:

André Loranger
Chief Statistician

Ottawa, Canada
September 15, 2026

Martin Chapman
Chief Financial Officer

Ottawa, Canada
September 15, 2026

Statement of Operations and Departmental Net Financial Position (Unaudited)
For the Year Ended March 31
(in thousands of dollars)
 

2026 Planned Results

2026 Actual

2025 Actual

Expenses

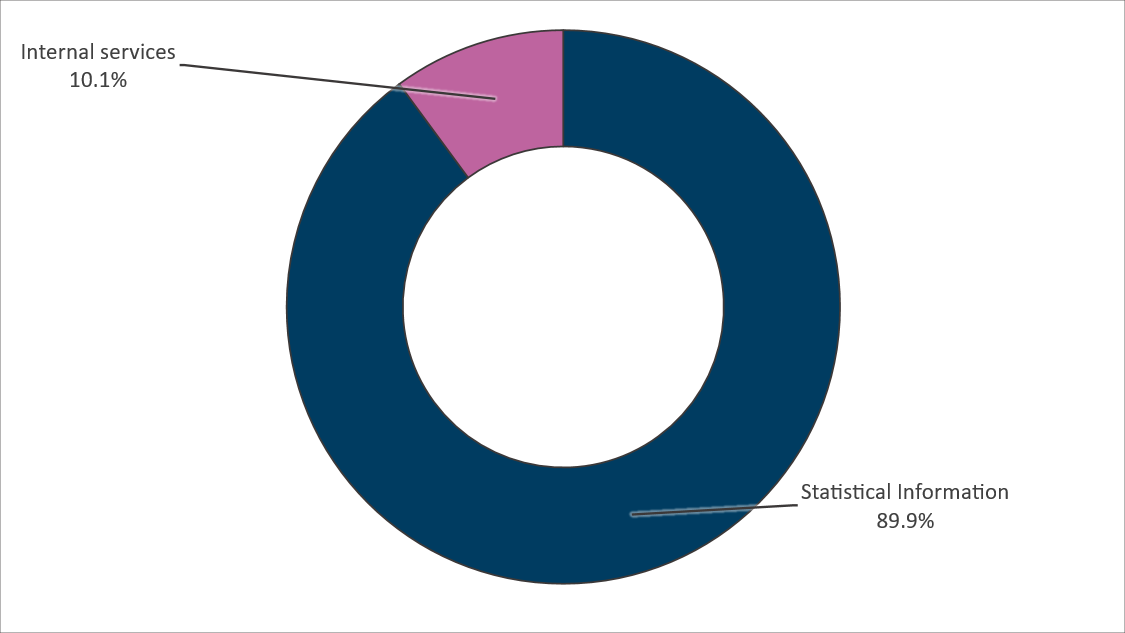
Statistical Information

1,017,091

921,116

858,895

Internal services

111,180

103,264

105,784

Total expenses

1,128,271

1,024,380

964,679

Revenues (note 5)

Special statistical services

144,300

133,806

157,020

Services to other government departments

0

158

0

Other revenues

39

14

20

Revenues earned on behalf of Government

(24,339)

(23,747)

(28,801)

Total revenues

120,000

110,231

128,239

Net cost of operations before government funding and transfers

1,008,271

914,149

836,440

Government funding and transfers

Net cash provided by Government of Canada
 

772,604

748,681

Change in due from Consolidated Revenue Fund
 

36,970

(15,903)

Services provided without charge by other federal government departments (note 11a)
 

109,215

97,362

Transfer of assets from other government departments
 

129

(116)

Net cost (net results) of operations after government funding and transfers


(4,769)

6,416

Departmental net financial position - Beginning of year


60,300

66,716

Departmental net financial position - End of year


65,069

60,300

Segmented information (note 12)

The accompanying notes form an integral part of these financial statements.

Statement of Change in Departmental Net Debt (Unaudited)
For the Year Ended March 31
(in thousands of dollars)
 

2026 Actual

2025 Actual

Net cost (net result) of operations after government funding and transfers

(4,769)

6,416

Change due to tangible capital assets

Acquisition of tangible capital assets (note 9)

17,225

20,813

Amortization of tangible capital assets (note 9)

(27,374)

(28,609)

Net loss on disposal/write-off of tangible capital assets including adjustments

(225)

(1,569)

Total change due to tangible capital assets

(10,374)

(9,365)

Change due to consumable supplies

89

(123)

Change due to prepaid expenses

(4,058)

2,791

Increase (decrease) in departmental net debt

(19,112)

(281)

Departmental net debt - Beginning of year

71,354

71,635

Departmental net debt - End of year

52,242

71,354

Statement of Cash Flows (Unaudited)
For the Year Ended March 31
(in thousands of dollars)
 

2026

2025

Operating activities

Net cost of operations before government funding and transfers

914,149

836,440

Non-cash items:
Amortization of tangible capital assets (note 9)

(27,374)

(28,609)

Net loss on disposal/write-off of tangible capital assets including adjustments

(225)

(1,569)

Services provided without charge by other federal government departments (note 11a)

(109,215)

(97,362)

Transfer of assets to other federal government departments

(129)

116

Variations in Statement of Financial Position:
Increase (decrease) in accounts receivable and advances

(866)

244

Increase (decrease) in prepaid expenses

(4,058)

2,791

Increase (decrease) in consumable supplies

89

(123)

Decrease (increase) in accounts payable and accrued liabilities

(23,667)

15,154

Decrease (increase) in vacation pay and compensatory leave

6,063

1,253

Decrease (increase) in deferred revenue

(424)

0

Decrease (increase) in employee future benefits

1,036

(467)

Cash used in operating activities

755,379

727,868

Capital investing activities

Acquisitions of tangible capital assets (note 9)

17,225

20,813

Cash used in capital investing activities

17,225

20,813

Net cash provided by Government of Canada

772,604

748,681

The accompanying notes form an integral part of these financial statements.

Notes to the Financial Statements (Unaudited) For the Year Ended March 31

1. Authority and objectives

Statistics Canada (the agency) was established in 1918, pursuant to the Statistics Act. The agency received full departmental status by order-in-council in 1965.

The agency is a division of the public service named in Schedule I.1 of the Financial Administration Act. The minister responsible for Statistics Canada is the Minister of Innovation, Science and Economic Development, who represents the agency in Parliament and in Cabinet.

The agency's mandate derives primarily from the Statistics Act. The act requires the agency — under the direction of the minister — to collect, compile, analyze, and publish statistical information on the economic, social, and general conditions of the country and its citizens. Statistics Canada has a mandate to coordinate and manage the country's statistical system.

The agency's mandate has two primary objectives:

  • Provide statistical information and analysis of the economic and social structure and functioning of Canadian society as a basis for the development, operation and evaluation of public policies and programs. This information is used for public and private decision-making, and for the general benefit of all Canadians.
  • Promote the quality, coherence, and international comparability of Canada's statistics through collaboration with other federal departments and agencies, with the provinces and territories, and in accordance with sound scientific standards and practices.

The agency reports on the two core responsibilities described below.

Statistical information - The agency has a responsibility to produce objective high-quality statistical information for the whole of Canada. The statistical information produced relates to the commercial, industrial, financial, social, economic, environmental, and general activities and conditions of the people of Canada.

Internal services - Internal services are groups of related activities and resources that are administered to support the needs of programs and other corporate obligations of an organization.

2. Summary of significant accounting policies

These financial statements are prepared using the agency's accounting policies stated below, which are based on Canadian public sector accounting standards. The presentation and results using the stated accounting policies do not result in any significant differences from Canadian public sector accounting standards.

The significant accounting policies are as follows:

(a) Parliamentary authorities

The agency is financed by the Government of Canada through Parliamentary authorities. Financial reporting of authorities provided to the agency do not parallel financial reporting according to generally accepted accounting principles since authorities are primarily based on cash flow requirements. Consequently, items recognized in the Statement of Operations and Departmental Net Financial Position and in the Statement of Financial Position are not necessarily the same as those provided through authorities from Parliament. Note 3 provides a reconciliation between the bases of reporting. The planned results amounts in the "Expenses" and "Revenues" sections of the Statement of Operations and Departmental Net Financial Position are the amounts reported in the Future-oriented Statement of Operations included in the 2025-26 Departmental Plan. Planned results are not presented in the "Government funding and transfers" section of the Statement of Operations and Departmental Net Financial Position and in the Statement of Change in Departmental Net Debt because these amounts were not included in the 2025-26 Departmental Plan.

(b) Net cash provided by Government

The agency operates within the Consolidated Revenue Fund (CRF), which is administered by the Receiver General for Canada. All cash received by the agency is deposited into the CRF, and all cash disbursements made by the agency are paid from the CRF. The net cash provided by the Government is the difference between all cash receipts and all cash disbursements, including transactions between departments of the Government.

(c) Amounts due from or to the CRF

Amounts due from or to the CRF are the result of timing differences at year-end between when a transaction affects authorities and when it is processed through the CRF. Amounts due from the CRF represent the net amount of cash that the agency is entitled to draw from the CRF without further authorities to discharge its liabilities.

(d) Revenues and deferred revenues

Revenues are comprised of revenues earned from non-tax sources. They include exchange transactions where goods or services are provided for consideration where a performance obligation exists, and non-exchange transactions where no performance obligations exist to provide a good or service. These transactions can be recurring or non-recurring in nature. Recurring transactions are viewed as ongoing, routine activities that form part of the normal course of operations and can be used to indicate if they can be reasonably expected to be earned again in future years.

Deferred revenue consists of amounts received in advance of the delivery of goods and rendering of services that will be recognized as revenue in a subsequent fiscal year as it is earned. Other revenues are recognized in the period the event giving rise to the revenues occurred.

Revenues that are non-respendable are not available to discharge the department's liabilities. While the chief statistician is expected to maintain accounting control, he or she has no authority regarding the disposition of non-respendable revenues. As a result, non-respendable revenues are earned on behalf of the Government of Canada and are therefore presented as a reduction of the entity's gross revenues. Revenues earned on behalf of Government consist of the sale of services and gains on the sale of assets. These are recognized when earned.

(e) Expenses

  • Transfer payments are recorded as an expense in the year the transfer is authorized, and all eligibility criteria have been met by the recipient.
  • Vacation pay and compensatory leave are accrued as the benefits are earned by employees under their respective terms of employment.
  • Services provided without charge by other government departments for accommodation, employer contributions to the health and dental insurance plans, and workers' compensation are recorded as operating expenses at their carrying value.

(f) Employee future benefits

  1. Pension benefits — Eligible employees participate in the Public Service Pension Plan, a multi-employer pension plan administered by the Government. The agency's contributions to the Plan are charged to expenses in the year incurred and represent the total departmental obligation to the Plan. The agency's responsibility with regard to the Plan is limited to its contributions. Actuarial surpluses or deficiencies are recognized in the financial statements of the Government of Canada, as the Plan's sponsor.
  2. Severance benefits — The accumulation of severance benefits for voluntary departures ceased for applicable employee groups. The remaining obligation for employees who did not withdraw benefits is calculated using information derived from the results of the actuarially determined liability for employee severance benefits for the Government as a whole.

(g) Financial Instruments

A contract establishing a financial instrument creates, at its inception, rights, and obligations to receive or deliver economic benefits. The financial assets and financial liabilities portray these rights and obligations in the financial statements. The Department recognizes a financial instrument when it becomes a party to a financial instrument contract.

Financial instruments consist of accounts receivable, and accounts payable and accrued liabilities. All financial assets and liabilities are recorded at cost. Any associated transaction costs are added to the carrying value upon initial recognition. When necessary, an allowance for valuation is recorded to reduce the carrying value of accounts receivable to amounts that approximate their net recoverable value.

(h) Non-financial assets

  • The costs of acquiring land, buildings, equipment, and other capital property are capitalized as tangible capital assets and, except for land, are amortized to expense over the estimated useful lives of the assets, as described in Note 9. All tangible capital assets and leasehold improvements having an initial cost of $10,000 or more are recorded at their acquisition cost. Tangible capital assets do not include immovable assets located on reserves as defined in the Indian Act, works of art, museum collection and Crown land to which no acquisition cost is attributable, and intangible assets.
  • Purchased intangibles are identifiable non-monetary economic resources without physical substance that are acquired in exchange transactions from arm's length third parties. Purchased intangibles exclude software, which is included in tangible capital assets. Commencing April 1, 2023, the cost of a purchased intangible is capitalized as an asset when the department controls the intangible and the intangible contributes to the capacity of the government to deliver services and products, generate future cash inflows or reduce cash outflows. Purchased intangible assets are amortized to expense over the estimated useful life of the assets. Prior to April 1, 2023, purchased intangibles were expensed as incurred.
  • Consumable supplies include items held for future program delivery and are not intended for resale. These supplies are recorded at the acquisition cost. If there is no longer a service potential, the supplies are valued at the lower of cost or net realizable value.

(i) Contingent liabilities

Contingent liabilities are potential liabilities which may become actual liabilities when one or more future events occur or fail to occur. If the future event is likely to occur or fail to occur, and a reasonable estimate of the loss can be made, a provision is accrued, and an expense recorded to other expenses. If the likelihood is not determinable or an amount cannot be reasonably estimated, the contingency is disclosed in the notes to the financial statements.

(j) Contingent assets

Contingent assets are possible assets which may become actual assets when one or more future events occur or fail to occur. If the future event is likely to occur or fail to occur, the contingent asset is disclosed in the notes to the financial statements.

(k) Transactions involving foreign currencies

Transactions involving foreign currencies are translated into Canadian dollar equivalents using rates of exchange in effect at the time of those transactions. Monetary assets and liabilities denominated in foreign currencies are translated into Canadian dollars using the rate of exchange in effect at March 31. The Government has elected to recognize gains and losses resulting from foreign currency translation, including those arising prior to settlement or derecognition of the financial instrument, directly on the Statement of Operations and Departmental Net Financial Position according to the activities to which they relate.

(l) Measurement uncertainty

The preparation of these financial statements requires management to make estimates and assumptions that affect the reported and disclosed amounts of assets, liabilities, revenues and expenses reported in the financial statements and accompanying notes at March 31. The estimates are based on facts and circumstances, historical experience, general economic conditions and reflect the Government's best estimate of the related amount at the end of the reporting period. The most significant items where estimates are used are the liability for employee future benefits and the useful life of tangible capital assets. Actual results could significantly differ from those estimated. Management's estimates are reviewed periodically and, as adjustments become necessary, they are recorded in the financial statements in the year they become known.

(m) Related party transactions

Related party transactions, other than inter-entity transactions, are recorded at the exchange amount. Inter-entity transactions are transactions between commonly controlled entities. Inter-entity transactions, other than restructuring transactions, are recorded on a gross basis and are measured at the carrying amount, except for the following:

  1. Services provided on a recovery basis are recognized as revenues and expenses on a gross basis and measured at the exchange amount.
  2. Certain services received on a without charge basis are recorded for departmental financial statement purposes at the carrying amount.

3. Parliamentary authorities

The agency receives most of its funding through annual parliamentary authorities. Items recognized in the Statement of Operations and Departmental Net Financial Position and the Statement of Financial Position in one year may be funded through parliamentary authorities in prior, current, or future years. Accordingly, the agency has different net results of operations for the year on a government funding basis than on an accrual accounting basis. The differences are reconciled in the following tables:

(a) Reconciliation of net cost of operations to current year authorities used

Reconciliation of net cost of operations to current year authorities used
 

2026

2025

(in thousands of dollars)

Net cost of operations before government funding and transfers

914,149

836,440

Adjustments for items affecting net cost of operations but not affecting authorities:

Amortization of tangible capital assets

(27,374)

(28,609)

Loss on disposal/write-off of tangible capital assets, including adjustments

(225)

(1,569)

Services provided without charge by other federal government departments

(109,215)

(97,362)

Decrease (increase) in vacation pay and compensatory leave

6,063

1,253

Decrease (increase) in employee future benefits

1,036

(467)

Refund of prior years' expenditures

323

840

Increase in respendable revenues

0

0

Consumption of prepaid expenses

(8,671)

(6,700)

Consumption of supplies

0

(123)

Bad debt expense

(263)

(281)

Increase (decrease) in accrued receivable

(304)

193

Adjustment to previous year disposal

34

0

Total items affecting net cost of operations but not affecting authorities

(138,596)

(132,825)

Adjustments for items not affecting net cost of operations but affecting authorities:

Acquisition of tangible capital assets

17,225

20,813

Decrease in respendable accounts receivable

(945)

(170)

Acquisition of prepaid expenses

4,614

9,493

Acquisition of consumable supplies

89

0

Increase in salary receivable

730

518

Increase in salary advances

0

4

Payments for pay equity settlement

14,419

0

Total items not affecting net cost of operations but affecting authorities

36,132

30,658

Current year authorities used

811,685

734,273

(b) Authorities provided and used

Authorities provided and used
 

2026

2025

(in thousands of dollars)

Authorities provided:

Vote 1 - Operating expenditures

754,130

679,131

Statutory amounts

102,588

96,249

Total authorities provided

856,718

775,380

Less:

Lapsed: Operating expenditures

(45,033)

(41,107)

Current year authorities used

811,685

734,273

4. Accounts payable and accrued liabilities

The following table presents details of the agency's accounts payable and accrued liabilities:

Accounts payable and accrued liabilities
 

2026

2025

(in thousands of dollars)

Accounts payable - Other federal government departments and agencies

4,304

10,096

Accounts payable - External parties

32,737

34,904

Accrued salaries and wages

72,216

40,590

Total accounts payables and accrued liabilities

109,257

85,590

5. Revenues

The department has the following major types of revenues: special statistical services, services to other government departments, miscellaneous revenues, and revenues earned on behalf of the Government. Miscellaneous revenues include gains on sales of assets, other gains on foreign exchange valuations and other fees and charges. These are recorded when performance obligations are satisfied.

(a) Disaggregated revenues

Disaggregated revenues
 

2026

2025

(in thousands of dollars)

Revenues

Special statistical services (exchange)

133,806

157,020

Services to other government departments (exchange)

158

0

Miscellaneous
Gains on sales of assets (exchange)

11

13

Gains on foreign exchange valuations (non-exchange)

3

2

Other fees and charges (exchange and non-exchange)

0

5

Total miscellaneous

14

20

Revenues earned on behalf of Government (exchange)

(23,747)

(28,801)

Total revenuesFootnote 1

110,231

128,239

Disaggregated revenues - Footnote 1

Total non-recurring revenues of $14 thousands were incurred in relation to Gains on sales of assets, Gains on foreign exchange valuations, and interest on overdue accounts receivable.

Disaggregated revenues - Return to footnote 1 referrer

6. Deferred revenue

The agency has the authority to expend revenue received during the fiscal year. Deferred revenue represents the balance at year-end of unearned revenues stemming from amounts received from external parties, which are restricted for specific statistical services. Revenue is recognized in the period in which these expenditures are incurred or in which the service is performed. Details of the transactions related to this account are as follows:

Deferred revenue
 

2026

2025

(in thousands of dollars)

Opening balance

0

0

Amount received

19,886

26,813

Revenues recognized

(19,462)

(26,813)

Net closing balance

424

0

7. Employee future benefits

(a) Pension benefits

The agency's employees participate in the Public Service Pension Plan ("the Plan"), which is sponsored and administered by the Government of Canada. Pension benefits accrue up to a maximum period of 35 years at a rate of 2 percent per year of pensionable service, times the average of the best five consecutive years of earnings. The benefits are integrated with Canada/Québec Pension Plan benefits and they are indexed to inflation.

Both the employees and the agency contribute to the cost of the Plan. Due to the amendment of the Public Service Superannuation Act following the implementation of provisions related to Economic Action Plan 2012, employee contributors have been divided into two groups – Group 1 relates to existing plan members as of December 31, 2012, and Group 2 relates to members who joined the Plan as of January 1, 2013.  Each group has a distinct contribution rate.

The 2025-26 expense amounts to $65,034 thousand ($61,726 thousand in 2024-25).  For Group 1 members, the expense represents approximately 1.01 times (1.02 times in 2024-25) the employee contributions and, for Group 2 members, approximately 1.00 times (1.00 times in 2024-25) the employee contributions.

The agency's responsibility with regard to the Plan is limited to its contributions. Actuarial surpluses or deficiencies are recognized in the Consolidated Financial Statements of the Government of Canada, as the Plan's sponsor.

(b) Severance benefits

Severance benefits provided to the agency's employees were previously based on an employee's eligibility, years of service and salary at termination of employment. However, since 2011 the accumulation of severance benefits for voluntary departures progressively ceased for substantially all employees. Employees subject to these changes were given the option to be paid the full or partial value of benefits earned to date or collect the full or remaining value of benefits upon departure from the public service. By March 31, 2018, substantially all settlements for immediate cash out were completed. Severance benefits are unfunded and, consequently, the outstanding obligation will be paid from future authorities.

The changes in the obligations during the year were as follows:

Severance benefit obligations
 

2026

2025

(in thousands of dollars)

Accrued benefit obligation - Beginning of year

13,916

13,449

Expense or adjustment for the year

10,732

1,623

Benefits paid during the year

(11,768)

(1,156)

Accrued benefit obligation - End of year

12,880

13,916

8. Accounts receivable and advances

The following table presents details of the agency's accounts receivable and advances balances:

Accounts receivable and advances
 

2026

2025

(in thousands of dollars)

Receivables - Other federal government departments and agencies

3,584

1,969

Receivables - External parties

7,333

8,892

Employees advances

483

57

Subtotal

11,400

10,918

Allowance for doubtful accounts on receivables from external parties

(824)

(561)

Gross accounts receivable and advances

10,576

10,357

Accounts receivable held on behalf of Government

(4,558)

(3,473)

Net accounts receivable and advances

6,018

6,884

The following table provides an aging analysis of accounts receivable from external parties and the associated valuation allowances used to reflect their net recoverable value:

Aging analysis of accounts receivable from external parties
 

2026

2025

(in thousands of dollars)

Accounts receivable from external parties:

Impaired

824

561

Not past due

5,401

6,730

Number of days past due
1 to 30

193

729

31 to 60

17

14

61 to 90

6

94

91 to 365

41

179

Over 365

851

585

Sub-total

7,333

8,892

Less: valuation allowance

(824)

(561)

Total

6,509

8,331

9. Tangible capital assets

Amortization of tangible capital assets is done on a straight-line basis over the estimated useful life of the asset as follows:

Amortization period of tangible capital assets

Asset class

Amortization period

Computer hardware

5 years

Computer software

5 years

Other equipment

5 years

Vehicles

7 years

Leasehold improvements

25 years

Assets under construction

Once available for use

Software under development

Once available for use

Assets under construction and software assets under development are recorded in the applicable asset class in the year that they become available for use and are not amortized until they are available for use.

Assets under construction and software assets under development

Capital Asset Class

Cost

Accumulated Amortization

Net Book Value

Opening Balance

Acquisitions

Disposals and Write-Offs

AdjustmentsAssets under construction and software assets under development - Footnote 1

Closing Balance

Opening Balance

Amortization

Disposals and Write-Offs

AdjustmentsAssets under construction and software assets under development - Footnote 1

Closing Balance

2026

2025

(in thousands of dollars)

Computer hardware

2,162

-

-

-

2,162

1,904

78

-

-

1,982

180

258

Computer software

410,349

-

(3,893)

22,737

429,193

338,258

25,029

(3,732)

-

359,555

69,638

72,091

Other equipment

4,197

362

-

-

4,559

3,092

285

-

-

3,377

1,182

1,105

Motor Vehicles

329

54

-

-

383

196

29

-

-

225

158

132

Other Vehicles

8,366

21

(18)

-

8,369

3,777

894

(18)

-

4,653

3,716

4,588

Leasehold improvements

26,428

215

-

-

26,643

14,453

1,059

-

-

15,512

11,131

11,975

Assets under construction

-

-

-

-

-

-

-

-

-

-

-

-

Software under development

32,106

16,573

-

(22,801)

25,878

-

-

-

-

-

25,878

32,108

Total

483,937

17,225

(3,911)

(64)

497,187

361,680

27,374

(3,750)

-

385,304

111,883

122,257

Assets under construction and software assets under development - Footnote 1

Included in adjustments are the following: software assets under development of $22,737 thousand that were transferred to computer software upon completion of the assets and $64 thousand that was expensed due to an adjustment of previous year capitalized software under development.

Assets under construction and software assets under development - Return to the first footnote 1 referrer

10. Contractual obligations and contractual rights

(a) Contractual obligations

The nature of the agency's activities may result in some large multi-year contracts and obligations whereby the agency will be obligated to make future payments when the services/goods are received. Significant contractual obligations that can be reasonably estimated are summarized as follows:

Contractual obligations
 

2027

2028

2029

2030

2031 and subsequent

Total

(in thousands of dollars)

Acquisition of goods and services

129,731

33,555

1

-

-

163,287

Total

129,731

33,555

1

-

-

163,287

(b) Contractual rights

The activities of the agency sometimes involve the negotiation of contracts or agreements with outside parties that result in the agency having rights to both assets and revenues in the future. They involve sales of goods and services. The agency does not have significant contractual rights to disclose as of March 31, 2026.

11. Related party transactions

The agency is related as a result of common ownership to all government departments, agencies, and Crown corporations. Related parties also include individuals who are members of key management personnel or close family members of those individuals, and entities controlled by, or under shared control of, a member of key management personnel or a close family member of that individual.

The agency enters into transactions with these entities in the normal course of business and on normal trade terms.

(a) Common services provided without charge by other federal government departments

During the year, the agency received services without charge from certain common service organizations related to accommodation, the employer's contribution to the health and dental insurance plans and workers' compensation coverage. These services provided without charge have been recorded at the carrying value in the agency's Statement of Operations and Departmental Net Financial Position as follows:

Common services provided without charge by other federal government departments
 

2026

2025

(in thousands of dollars)

Accommodation

42,308

41,184

Employer's contribution to the health and dental insurance plans

66,878

56,139

Worker's compensation

29

39

Total

109,215

97,362

The Government has centralized some of its administrative activities for efficiency, cost-effectiveness purposes and economic delivery of programs to the public. As a result, the Government uses central agencies and common service organizations so that one department performs services for all other departments and agencies without charge. The costs of these services, such as the payroll and cheque issuance services provided by Public Services and Procurement Canada and audit services provided by the Office of the Auditor General are not included in the agency's Statement of Operations and Departmental Net Financial Position.

(b) Other transactions with other federal government departments and agencies

Other transactions with other federal government departments and agencies
 

2026

2025

(in thousands of dollars)

Accounts receivable

3,584

1,969

Accounts payable

4,304

10,096

Expenses

29,052

21,564

Revenues

94,284

106,430

Expenses and revenues disclosed in (b) exclude common services provided without charge, which are already disclosed in (a).

12. Segmented information

Presentation by segment is based on the agency's core responsibilities. The presentation by segment is based on the same accounting policies as described in the Summary of significant accounting policies in note 2. The following table presents the expenses incurred and revenues generated for the main core responsibilities, by major object of expense and by major type of revenue. The segment results for the period are as follows:

Expenses incurred and revenues generated for the main core responsibilities
 

Statistical Information

Internal services

2026 Total

2025 Total

(in thousands of dollars)

Operating expenses

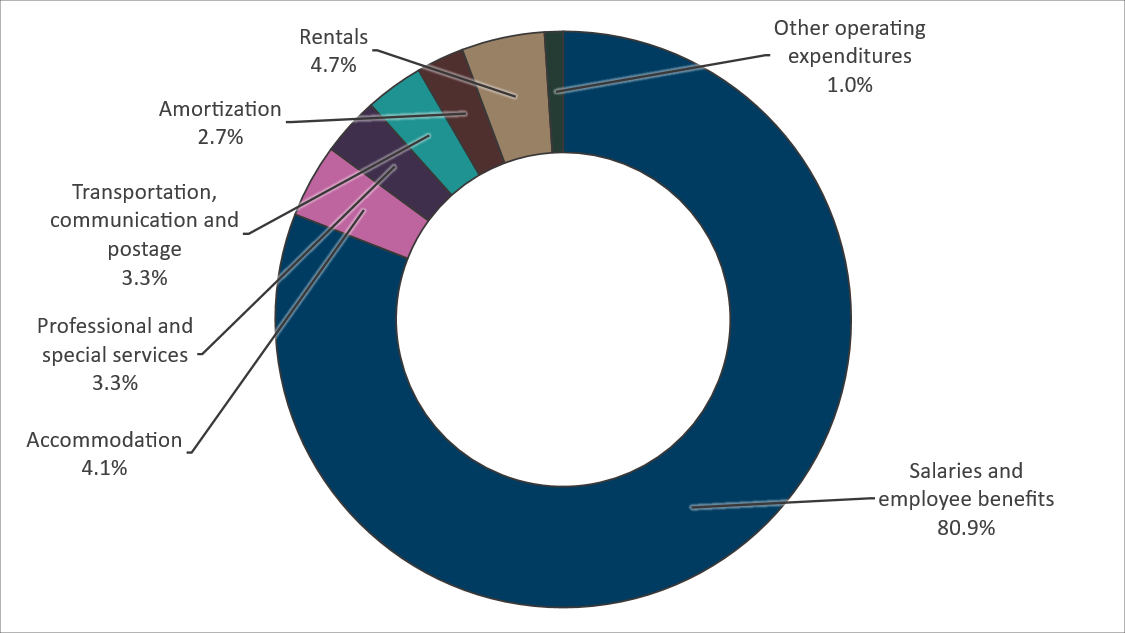
Salaries and employee benefits

745,988

83,030

829,018

781,384

Accommodation

38,070

4,237

42,307

41,183

Professional and special services

27,482

6,238

33,720

33,556

Transportation, communication, and postage

32,485

914

33,399

20,291

Amortization

26,642

732

27,374

28,609

Repairs and maintenance

573

210

783

1,216

Utilities, materials and supplies

3,773

819

4,592

10,665

Rentals

40,750

6,937

47,687

37,645

Information

19,378

129

19,507

9,051

Loss on disposal/write-off of tangible capital assets

143

19

162

676

Other operating expenses

(14,168)

(1)

(14,169)

403

Total operating expenses

921,116

103,264

1,024,380

964,679

Total expenses

921,116

103,264

1,024,380

964,679

Revenues

Special statistical services

133,806

-

133,806

157,020

Services to other government services

0

158

158

-

Other revenues

14

-

14

20

Revenues earned on behalf of Government

(23,747)

-

(23,747)

(28,801)

Total revenues

110,073

158

110,231

128,239

Net cost from continuing operations

811,043

103,106

914,149

836,440

Annex to the Statement of Management Responsibility Including Internal Control over Financial Reporting of Statistics Canada for Fiscal Year 2025-2026 (Unaudited)

1. Introduction

This document is attached to Statistics Canada's (StatCan) Statement of Management Responsibility Including Internal Control over Financial Reporting for the 2025-2026 fiscal year. This annex provides summary information on the measures taken by StatCan to maintain an effective system of internal control over financial reporting (ICFR), as well as information on internal control management, assessment results and related action plans.

Detailed information on the agency's authority, mandate and core responsibilities can be found in the Statistics Canada's 2026-27 Departmental Plan, Statistics Canada's 2025-26 Departmental Plan and the Statistics Canada's 2024-25 Departmental results report.

2. Departmental system of internal control over financial reporting

2.1 Internal control management

StatCan has a well-established governance and accountability structure to support departmental assessment efforts and oversight of its overall system of internal control. A departmental internal control management framework, approved by the Chief Financial Officer (CFO), is in place and comprises:

  • organizational accountability structures as they relate to internal control management to support sound financial management, including roles and responsibilities of senior managers for control management in their areas of responsibility;
  • values and ethics;
  • ongoing communication and training on the legislative and policy requirements for sound financial management and control; and
  • monitoring and regular updates on internal control management, as well as provision of related assessment results and action plans to the Chief Statistician and senior departmental management and, as applicable, to the Departmental Audit Committee (DAC).

The DAC provides advice to the Chief Statistician on the adequacy and effectiveness of the agency's risk management, control and governance frameworks and processes.

2.2 Service arrangements relevant to financial statements

StatCan relies on other organizations for processing certain transactions that are recorded in its financial statements, as follows:

2.2.1 Common service arrangements
  • Public Services and Procurement Canada (PSPC) administers the payment of salaries, the procurement of certain goods and services, and provides accommodation services;
  • Shared Services Canada (SSC) provides information technology (IT) infrastructure services;
  • The Department of Justice Canada provides legal services; and
  • The Treasury Board of Canada Secretariat (TBS) provides information on public service insurance and centrally administers payment of the employer's share of contribution toward statutory employee benefit plans.
2.2.2 Specific arrangements
  • PSPC provides StatCan with the Common Departmental Financial System platform to capture and report financial and material management transactions, as well as procurement information. 

Readers of this annex may refer to the annexes of the above-noted departments for a greater understanding of the systems of internal control over financial reporting (ICFR) related to these specific services.

3. StatCan assessment results for the 2025-2026 fiscal year

StatCan adopted an ongoing, rotational, risk-based monitoring approach to support testing of internal control over financial reporting. In 2024, StatCan updated its Internal Control over Financial Management (ICFM) Ongoing Monitoring Framework, which replaced its previous version from 2020. According to the new strategy, the ongoing monitoring cycle was extended to a five-year period, and the plan is adjusted through an annual environmental scan process.

The following table summarizes the status of the ongoing monitoring activities according to the previous fiscal year's rotational plan under ICFR and ICFM.

Progress during the 2025-2026 fiscal year

Previous fiscal year's rotational ongoing monitoring plan for current fiscal year
 

Status

Internal Controls Over Financial Reporting

Revenue

Completed as planned; remedial actions completed.

Capital Assets

Completed as planned; remedial actions started.

Information technology general controls under agency management - (Medium risk)

Completed as planned; remedial actions started.

Information technology general controls under agency management - Cloud

Completed as planned; remedial actions started.

Information technology general controls under agency management - Customer Relationship Management System (CRMS)

Completed as planned; remedial actions started.

Entity Level Controls

Completed as planned; remedial actions started.

Procurement

Design Effectiveness stage completed. Operating Effectiveness testing will conclude during 2026-2027.

Internal Controls Over Financial Management

Chief Financial Officer (CFO) Attestation

Completed as planned; remedial actions started.

Procurement

Design Effectiveness stage completed. Operating Effectiveness testing will conclude during 2026-2027.

New or significantly amended key controls are summarized in section 3.1. The areas of the departmental system of internal controls that were reviewed this fiscal year are summarized in section 3.2.

3.1 New or significantly amended key controls

In the current fiscal year, there were no significantly amended key controls in existing processes that required a reassessment.

In fiscal year 2025-2026, Statistics Canada completed the design effectiveness testing for newly implemented controls related to the Forecasting, Payroll and Benefits, and Operating Expenditures processes. These controls will require reassessment as part of ongoing monitoring activities. These controls were established to strengthen processes and ensure the availability of funds prior to approval. As part of this initiative, complementary oversight controls were introduced to enhance senior management's awareness of material disbursements before Section 32 authorization is granted.

3.2 Ongoing monitoring program

As part of its rotational ongoing monitoring plan, the agency completed its reassessment of IT General Controls (ITGCs) under medium risk, Cloud and Customer Relationship Management System (CRMS) and the financial controls within the business processes of:

  • Revenues
  • Capital Assets
  • Entity Level Controls
  • CFO Attestation of Cabinet and TB Submissions
  • Forecasting (Design Effectiveness of new controls)

Management action plans addressing the recommendations were developed by the business process owners.

4. Statistics Canada action plan for the next fiscal year (2026-2027) and subsequent fiscal years

Statistics Canada's rotational ongoing monitoring plan over the next three years is shown in the following table. The ongoing monitoring plan is based on:

  • an annual validation of high-risk processes and controls; and
  • related adjustments to the ongoing monitoring plan as required.

An annual risk assessment is conducted to validate the high-risk controls and to adjust the ongoing monitoring plan as required. Action plans from previous years will be followed up on to ensure that remedial actions have been taken.

Rotational ongoing monitoring plan

Internal Control over Financial Reporting

Key control areas

Fiscal Year 2026–2027

Fiscal Year 2027–2028

Fiscal Year 2028–2029

Entity-level controls

No

No

No

Information technology general controls under agency management

Yes

Yes

Yes

Capital assets

No

No

No

Financial close and reporting

Yes

No

Yes

Operating expenditures

No

Yes

No

Revenues

No

Yes

No

Census payroll

Yes

No

No

Payroll and benefits

Yes

No

Yes

Stage of monitoring

Internal Control over Financial Management

Key control areas

Fiscal Year 2026–2027

Fiscal Year 2027–2028

Fiscal Year 2028–2029

Budgeting

Ongoing Monitoring

Ongoing Monitoring

Ongoing Monitoring

Costing

Ongoing Monitoring

Ongoing Monitoring

Ongoing Monitoring

Forecasting

Ongoing Monitoring

Ongoing Monitoring

Ongoing Monitoring

Payroll

Ongoing Monitoring

Ongoing Monitoring

Ongoing Monitoring

CFO Attestation of Cabinet and TB Submissions

Ongoing Monitoring

Ongoing Monitoring

Ongoing Monitoring

Investment Planning

Ongoing Monitoring

Ongoing Monitoring

Ongoing Monitoring

Procurement

Operating Effectiveness

Operating Effectiveness

Ongoing Monitoring

Statistics Canada's 2025–26 Departmental Results Report
Supplementary Information Tables

Gender-based Analysis Plus

Section 1: institutional GBA Plus governance and capacity

Governance

In 2025–26, Statistics Canada continued to strengthen its commitment to Gender-based Analysis Plus (GBA Plus) by enhancing governance structures, fostering collaboration and integrating intersectional analysis across its operations.

The GBA Plus Champion continued to lead both the GBA Plus Responsibility Network and the Community of Practice, which brought employees together to share knowledge, exchange best practices and strengthen awareness of GBA Plus.

Statistics Canada initiated the development of a GBA Plus strategy to formalize and expand the implementation of GBA Plus and increase awareness throughout the agency. In addition, GBA Plus analyses were conducted on memoranda to Cabinet and Treasury Board submissions to ensure alignment with GBA Plus principles.

Statistics Canada participated in Women and Gender Equality Canada's GBA Plus Learning Advisory Committee and Interdepartmental Committee of GBA Plus Focal Points, supporting cross-departmental initiatives and sharing information on the Disaggregated Data Action Plan and GBA Plus. The agency also represented Canada at the United Nations Economic Commission for Europe and the United Nations Inter-Agency and Expert Group on Gender Statistics, contributing to the development of global standards on gender.

Capacity

In 2025–26, Statistics Canada continued to strengthen its capacity to conduct and apply GBA Plus by improving access to disaggregated data, building tools and resources, strengthening employee knowledge, and engaging partners to better understand data needs. These efforts supported the integration of GBA Plus into programs, analysis and dissemination. The Disaggregated Data Action Plan remained central these efforts. The initiative addressed data and knowledge gaps to support more representative data collection across population groups and geographic levels.

The Gender, Diversity and Inclusion Statistics (GDIS) Hub continued to improve access to disaggregated data and related resources for employees and the public, supporting the application of GBA Plus.

Statistics Canada engaged with partners and stakeholders to better understand data needs and inform product development, strengthening the relevance of data products and supporting the integration of GBA Plus considerations into agency activities.

Statistics Canada continued to advance workforce diversity and inclusion through the implementation of its multi-year Equity, Diversity and Inclusion Action Plan. This plan focuses on increasing the representation of equity-deserving groups, eliminating systemic barriers and fostering an inclusive work environment.

Human resources (full-time equivalents) dedicated to GBA Plus

In 2025–26, Statistics Canada maintained a dedicated 0.5 full-time equivalent to support the implementation of GBA Plus across the agency. This role was complemented by a network of champions, field representatives and a Community of Practice that facilitated communication, promoted awareness and supported the integration of GBA Plus into agency programs and activities.

The governance structure included:

  • The GBA Plus Champion at the assistant director level provided updates to senior management and promoted GBA Plus initiatives and results across the agency.
  • One representative from each field acted as a liaison and local point of contact to identify GBA Plus-related initiatives and opportunities within their respective areas.
  • A GBA Plus Community of Practice resource supported employees by sharing practical information, guidance and examples to help integrate GBA Plus considerations into their work.

Section 2: gender and diversity impacts, by program

Program name: Socio-economic Statistics

Core responsibility

Statistical information

Program goals

The Socio-economic Statistics program provides integrated information and relevant analysis on the demographic and socio-economic characteristics of individuals, families and households and the factors that affect their well-being. Many of the statistical products produced allow for GBA Plus analyses of key population groups.

Target population

All Canadians

Distribution of benefits

Distribution

Group

By gender

The benefitting group has no notable characteristics beyond the Canadian population overall (no one group disproportionately benefits over another).

By income level

The benefitting group has no notable characteristics beyond the Canadian population overall (no one group disproportionately benefits over another).

By age group

The benefitting group has no notable characteristics beyond the Canadian population overall (no one group disproportionately benefits over another).

Specific demographic groups to be monitored
  • Directly impacted groups: All Canadians, with a focus on capturing diverse experiences and outcomes through disaggregated data and analysis across a range of sociodemographic characteristics.
  • Indirectly impacted groups: Stakeholders such as governments, businesses, academic institutions and other organizations that rely on statistical data and analysis to inform policies and programs.
  • Groups facing barriers: Populations that have historically experienced barriers to data representation or access, with targeted efforts to improve inclusion and visibility through disaggregated data collection and analysis.
Key program impacts on gender and diversity

In 2025–26, the Socio-economic Statistics program expanded its GBA Plus-related data products and improved access to disaggregated population information. It also incorporated feedback from communities and government partners to strengthen survey content, tools and dissemination products. In line with agency-wide requirements, all applicable Statistics Canada programs maintained data collection plans to report on gender and diversity impacts.

Key program impact statistics

Statistic

Observed resultsSocio-economic Statistics - Footnote 1

Data source

Comment

Number of GBA Plus-related statistical products (e.g., catalogued products, such as data tables, research articles, studies, fact sheets, infographics, interactive dashboards, reference products, public use microdata files, minor and major releases disseminated through The Daily) made available on Statistics Canada's website

327

Administrative data file

The GBA Plus factors considered in the calculation of this performance indicator comprise one or more of the following population characteristics included in the GDIS catalogue in 2025–26: sex, gender, age, geography, language, income, Indigenous identity, 2SLGBTQ+ identity, education, racialized group, ethnic origin, religion and disability status.

Number of GBA Plus outreach activities (e.g., consultations, presentations) for external stakeholders (e.g., other government departments, academia, non-governmental organizations)

10


Presentations on the application of GBA Plus and intersectional analysis were delivered to various departments and the GBA Plus Learning Advisory Committee.

Number of training and awareness initiatives related to GBA Plus

6


The GBA Plus Community of Practice delivered webinars that reinforced the application of GBA Plus across analytical domains and promoted best practices.

Number of visits to the GDIS Hub and sub-pagesSocio-economic Statistics - Footnote 2

34,542

Administrative data file

In 2025–26, the GDIS Hub received 34,542 page views, an increase of 16% from the previous fiscal year.

Number of Gender Results Framework indicators released by sex or gender and other identity factorSocio-economic Statistics - Footnote 2

49

Interactive dashboards available on the GDIS Hub


Socio-economic Statistics - Footnote 1

2025–26 or most recent

Socio-economic Statistics - Return to footnote 1 referrer

Socio-economic Statistics - Footnote 2

The indicator is applicable only to the Socio-economic Statistics program.

Socio-economic Statistics - Return to the first footnote 2 referrer

Other key program impacts

The program's emphasis on GBA Plus resulted in:

  • expanded availability of disaggregated data to better understand socio-economic differences among population groups;
  • more inclusive policy development informed by stakeholder consultations and outreach activities;
  • improved access to gender, diversity and inclusion-related data through the GDIS Hub.
Supplementary information sources

The GDIS Hub is Statistics Canada's primary platform for accessing gender, diversity and inclusion-related data, including disaggregated data, analytical products and insights. The hub also provides access to selected outputs from cost-recovered statistical services.

Statistics Canada released analytical products that provided disaggregated and intersectional analysis on the characteristics, experiences and outcomes of diverse population groups.

Key releases included

Examples of GBA Plus-related work included strengthening data collection, expanding equity-focused analysis and developing linked analytical resources. The second iteration of the Survey of Safety in Public and Private Spaces included oversampling of Indigenous populations, various gender identity populations, including non-binary and transgender people, and youth aged 15 to 24. This design supported the production of disaggregated and intersectional analysis on gender-based violence.

Justice-related data products expanded understanding of outcomes across population groups. The study Disparities in decision and sentencing outcomes between Indigenous accused and White accused in adult criminal court, 2016/2017 to 2020/2021, examined differences in adult criminal court outcomes by Indigenous group, age, gender and province or region. The release, Trends in reconvictions among adults sentenced to provincial custody or community supervision, 2015/2016 to 2020/2021, included data tables on annual reconviction rates for Nova Scotia, Ontario, Saskatchewan, Alberta and British Columbia, with breakdowns by age, gender, Indigenous identity and racialized group.

Statistics Canada also released a national birth cohort file in the research data centres. The file integrates criminal justice system, economic and sociodemographic data up to 2021—including gender, racialized group and Indigenous identity—for individuals born in 1997. This new resource supports analysis of juvenile and early adult contact with the criminal justice system.

GBA Plus data collection plan

In 2025–26, data requirements to measure gender and diversity impacts remained in place. Investments in the Disaggregated Data Action Plan supported improvements to data collection and analysis, including through the Labour Force Survey, the General Social Survey and the Canadian Community Health Survey. These efforts strengthened Statistics Canada's ability to capture and analyze the experiences of diverse population groups, including by addressing data gaps and improving the availability of disaggregated information. For example, these strengthened data capabilities supported analytical products such as the report Labour market characteristics of persons with and without disabilities, 2024, which provided analysis of labour market outcomes for persons with and without disabilities. Statistics Canada continued to identify data gaps and opportunities to improve data collection for diverse populations.

Program name: Censuses

Core responsibility

Statistical information

Program goals

The Censuses program provides comprehensive information on Canada's population and agricultural sector to support policy and program development. The Census of Population provides a socioeconomic portrait of people in Canada, while the Census of Agriculture provides essential information on Canada's farming sector. Linking census data enables disaggregated analysis across population groups, industries and geographic areas.

Target population

All Canadians

Distribution of benefits

Distribution

Group

By gender

The benefitting group has no notable characteristics beyond the Canadian population overall (no one group disproportionately benefits over another).

By income level

The benefitting group has no notable characteristics beyond the Canadian population overall (no one group disproportionately benefits over another).

By age group

The benefitting group has no notable characteristics beyond the Canadian population overall (no one group disproportionately benefits over another).

Key program impacts on gender and diversity

This initiative produces statistics that provide a detailed and comprehensive statistical portrait of people in Canada, including small population groups and those living in small geographic areas, which supports GBA Plus and evidence-based decision making.

Census information is central to planning, administration, policy development and evaluation activities at all levels of government. It is also used by the private sector, civil society organizations and other data users in their planning and decision-making processes. Therefore, all people in Canada directly benefit from the censuses.

Key program impact statistics

Statistic

Observed resultsCensuses - Footnote 1

Data source

Comment

Number of GBA Plus-related statistical products (e.g., catalogued products, such as data tables, research articles, studies, fact sheets, infographics, interactive dashboards, reference products, public use microdata files, minor and major releases disseminated through The Daily) made available on Statistics Canada's website

29

Administrative data file


Number of GBA Plus outreach activities (e.g., consultations, presentations) for external stakeholders (e.g., other government departments, academia, non-governmental organizations)

1


This activity reflects engagement with the Canadian Black Farmers Association.

Number of training and awareness initiatives related to GBA Plus

2


These activities reflect awareness of GBA Plus with Agriculture and Agri-Food Canada.

Number of surveys or other collection tools collecting data on the following GBA Plus identity factors: gender and sexual orientation

1


2026 Census of Population

Censuses - Footnote 1

2025–26 or most recent

Censuses - Return to footnote 1 referrer

GBA Plus data collection plan

In 2025–26, Statistics Canada reviewed its data requirements to identify gaps and opportunities to strengthen the measurement of gender and diversity. Following consultation, testing and evaluation, the content for the 2026 Census of Population was finalized and published in the Canada Gazette on July 5, 2025. Changes from the previous cycle included the addition of a question on sexual orientation to enhance the availability of data for GBA Plus and equity-related analysis. Statistics Canada also published The road to the 2026 Census, a series of fact sheets and technical reports explaining the content changes.

Program name: Centres of Expertise

Core responsibility

Statistical information

Program goals

The Centres of Expertise provide data and analytical insights through research, data linkages and innovative methods. In 2025–26, they continued to integrate GBA Plus perspectives into published research and advanced inclusive approaches to data collection, analysis, integration and dissemination.

Target population

All Canadians

Distribution of benefits

Distribution

Group

By gender

The benefitting group has no notable characteristics beyond the Canadian population overall (no one group disproportionately benefits over another).

By income level

The benefitting group has no notable characteristics beyond the Canadian population overall (no one group disproportionately benefits over another).

By age group

The benefitting group has no notable characteristics beyond the Canadian population overall (no one group disproportionately benefits over another).

Specific demographic groups to be monitored
  • Directly impacted groups: All Canadians, with a focus on producing disaggregated data and analysis that reflect the diverse experiences and outcomes of different population groups.
  • Indirectly impacted groups: Governments, businesses, academic institutions and other organizations that use Statistics Canada's data and analysis to inform decision-making, policies and programs.
  • Groups facing barriers: Populations that have historically been underrepresented in statistical data or experienced barriers to participation, with ongoing efforts to improve inclusion, representation and visibility through enhanced data collection and analysis.
Key program impacts on gender and diversity

The Centres of Expertise integrated GBA Plus considerations into data development frameworks and analysis to strengthen the evidence base on gender and diversity. Key releases included:

Key program impact statistics 
Key program impact statistics

Statistic

Observed resultsCentres of Expertise - Footnote 1

Data source

Comment

Number of GBA Plus-related statistical products (e.g., catalogued products, such as data tables, research articles, studies, fact sheets, infographics, interactive dashboards, reference products, public use microdata files, minor and major releases disseminated through The Daily) made available on Statistics Canada's website

84

Administrative data files


Number of GBA Plus outreach activities (e.g., consultations, presentations) for external stakeholders (e.g., other government departments, academia, non-governmental organizations)

7


Number of training and awareness initiatives related to GBA Plus

0


Centres of Expertise - Footnote 1

2025–26 or most recent

Centres of Expertise - Return to footnote 1 referrer

Other key program impacts

The Centres of Expertise continued to strengthen analysis of intersectional issues by integrating GBA Plus considerations into statistical products, improving understanding of differences across population groups.

Supplementary information sources

Health Reports, Insights on Canadian Society, and Economic and Social Reports are Statistics Canada's primary platforms for disseminating analytical reports produced by the Centres of Expertise. The Centres also publish the Business Ownership Diversity Dashboard. The products present gender-, diversity- and inclusion-related data and analysis where population sizes permit disaggregation. The Canadian Employer–Employee Dynamics Database is a key data linkage system supporting GBA Plus analysis.

GBA Plus data collection plan

The Centres of Expertise continued to leverage data from across Statistics Canada to produce disaggregated data and expand analytical insights on gender and diversity.

Program name: Cost-recovered Statistical Services

Core responsibility

Statistical information

Program goals

Through the Cost-recovered Statistical Services program, Statistics Canada conducts special surveys, produces statistics not available through existing data holdings and undertakes analytical projects to meet specific client needs. The program integrates GBA Plus by considering diverse demographic factors in data collection and analysis.

Target population

The program serves all Canadians, with a focus on collecting data that reflect diverse gender identities, cultural backgrounds and socio-economic circumstances. This supports the production of inclusive, intersectional and representative statistical information to inform evidence-based decision making.

Distribution of benefits

Distribution

Group

By gender

The benefitting group has no notable characteristics beyond the Canadian population overall (no one group disproportionately benefits over another).

By income level

The benefitting group has no notable characteristics beyond the Canadian population overall (no one group disproportionately benefits over another).

By age group

The benefitting group has no notable characteristics beyond the Canadian population overall (no one group disproportionately benefits over another).

Specific demographic groups to be monitored
  • Directly impacted groups: All Canadians, with a focus on producing disaggregated data and analysis that reflect the diverse experiences and outcomes of different population groups.
  • Indirectly impacted groups: Governments, businesses, academic institutions and other organizations that use Statistics Canada's products to inform decision-making, policies and programs.
  • Groups facing barriers: Populations that have historically been underrepresented in statistical data or faced barriers to participation, with ongoing efforts to improve inclusion and visibility through enhanced data collection and analysis.
Key program impacts on gender and diversity

Statistics Canada provided partners with statistical programs, custom surveys, data integration, analytical products and methodological expertise to support GBA Plus and address specific policy and program needs. These services generated evidence on differences in outcomes across population groups to inform policies, programs and services.

In support of GBA Plus, Statistics Canada also released statistical products that provided disaggregated data and intersectional analysis on the characteristics, experiences and outcomes of different population groups.

Key releases included:

Other key program impacts

These statistical products are developed through cost-recovered statistical services that support the design and delivery of surveys, including:

  • Canadian Survey on Disability
    The Canadian Survey on Disability provides information on the lived experiences and socio-economic outcomes of persons with disabilities in Canada. The survey supports analysis of how disability intersects with gender, age, employment, income, education, geography and other characteristics, helping identify barriers, measure disparities and inform policies and programs that promote accessibility and inclusion.
  • Canadian Veteran Health Survey
    The Canadian Veteran Health Survey provides information on Veterans' health, well-being, transition to civilian life, chronic conditions, labour force participation and use of supports. These data support analysis of differences in needs and outcomes across Veteran populations by gender, age, disability status and other intersecting characteristics, informing programs and services.
  • Longitudinal Immigration Database (IMDB)
    The Longitudinal Immigration Database provides information on the socio-economic outcomes of immigrants following admission, including employment income and mobility. It links these outcomes with admission characteristics, such as immigration category, source country and knowledge of official languages, supporting disaggregated analysis of immigrant experiences.
  • Canada's Anti-Racism Strategy
    Statistics Canada's analytical work—as published in the Ethnicity, Language and Immigration Thematic Series—supporting Canada's Anti-Racism Strategy improves the availability and use of disaggregated data on racialized groups, Indigenous Peoples and ethnocultural communities. These data support analysis of systemic racism and discrimination, including how they intersect with gender, disability, age, immigrant status, income and geography, informing evidence-based policies and programs.
Key program impact statistics

Statistic

Observed resultsCost-recovered Statistical Services - Footnote 1

Data source

Comment

Number of GBA Plus-related statistical products (e.g., catalogued products, such as data tables, research articles, studies, fact sheets, infographics, interactive dashboards, reference products, public use microdata files, minor and major releases disseminated through The Daily) made available on Statistics Canada's website

233

Administrative data file


Number of surveys or other collection tools collecting data on the following GBA Plus identity factors: gender and sexual orientation

10


Cost-recovered Statistical Services - Footnote 1

2025–26 or most recent

Cost-recovered Statistical Services - Return to footnote 1 referrer

1 2025–26 or most recent

Supplementary information sources

The GDIS Hub is Statistics Canada's primary platform for accessing gender-, diversity- and inclusion-related data. It provides streamlined access to disaggregated and intersectional data, analytical products and insights. The GDIS Hub also includes publicly available outputs from cost-recovered statistical services, broadening access to specialized analyses that support equity-informed decision making.

GBA Plus data collection plan

In 2025–26, Statistics Canada continued to assess data requirements for measuring gender and diversity impacts, identifying data gaps and opportunities to improve the relevance, inclusiveness and quality of data collection.

Program name: Economic and Environmental Statistics

Core responsibility

Statistical information

Program goals

The Economic and Environmental Statistics program produces economic and environmental statistics that support analysis and decision-making in areas such as the national accounts, business activity, prices, trade, agriculture and the environment.

Target population

All Canadians

Distribution of benefits

Distribution

Group

By gender

The benefitting group has no notable characteristics beyond the Canadian population overall (no one group disproportionately benefits over another).

By income level

The benefitting group has no notable characteristics beyond the Canadian population overall (no one group disproportionately benefits over another).

By age group

The benefitting group has no notable characteristics beyond the Canadian population overall (no one group disproportionately benefits over another).

Key program impact statistics

Statistic

Observed resultsEconomic and Environmental Statistics - Footnote 1

Data source

Comment

Number of GBA Plus-related statistical products (e.g., catalogued products, such as data tables, research articles, studies, fact sheets, infographics, interactive dashboards, reference products, public use microdata files, minor and major releases disseminated through The Daily) made available on Statistics Canada's website

187

Administrative data files received from program areas


Number of GBA Plus outreach activities (e.g., consultations, presentations) for external stakeholders (e.g., other government departments, academia, non-governmental organizations)

7


A series of presentations was given to various partners and stakeholders, including Women Business Enterprise Canada Council and Indigenous Services Canada.

Number of training and awareness initiatives related to GBA Plus

0


Economic and Environmental Statistics - Footnote 1

2025–26 or most recent

Economic and Environmental Statistics - Return to footnote 1 referrer

Scales

Gender scale

  • First group: predominantly men (80% or more men)
  • Second group: 60% to 79% men
  • Third group: broadly gender-balanced
  • Fourth group: 60% to 79% women
  • Fifth group: predominantly women (80% or more women)

Income‑level scale

  • First group: strongly benefits low‑income individuals (strongly progressive)
  • Second group: somewhat benefits low‑income individuals (somewhat progressive)
  • Third group: no significant distributional impacts
  • Fourth group: somewhat benefits high‑income individuals (somewhat regressive)
  • Fifth group: strongly benefits high‑income individuals (strongly regressive)

Age‑group scale

  • First group: primarily benefits youth, children or future generations
  • Second group: no significant intergenerational impacts or impacts on generations between youths and seniors
  • Third group: primarily benefits seniors or the baby boomer generation

Quarterly Survey of Financial Statements: Weighted Asset Response Rate - second quarter 2026

Weighted Asset Response Rate
Table summary
This table displays the results of Weighted Asset Response Rate. The information is grouped by Release date (appearing as row headers), 2025 Q2, Q3 and Q4 and 2026 Q1 and Q2 calculated using percentage units of measure (appearing as column headers).
Release date20252026
Q2Q3Q4Q1Q2
percentage
August 24, 202684.583.178.678.062.1
May 25, 202684.583.178.659.7 
February 25, 202681.878.258.1  
November 24, 202574.861.0   
August 25, 202561.4    
.. not available for a specific reference period
Source: Quarterly Survey of Financial Statements (2501)

Quarterly Financial Report for the quarter ended June 30, 2026

Statement outlining results, risks and significant changes in operations, personnel and program

A) Introduction

Statistics Canada's mandate

Statistics Canada ("the agency") is a member of the Innovation, Science and Economic Development portfolio.

Statistics Canada's role is to ensure that Canadians have access to a trusted source of statistics on Canada that meets their highest priority needs.

The agency's mandate derives primarily from the Statistics Act. The Act requires that the agency collects, compiles, analyzes and publishes statistical information on the economic, social, and general conditions of the country and its people. It also requires that Statistics Canada conduct the 2026 Census of Population and the 2026 Census of Agriculture every fifth year and protects the confidentiality of the information with which it is entrusted.

Statistics Canada also has a mandate to co-ordinate and lead the national statistical system. The agency is considered a leader, among statistical agencies around the world, in co–ordinating statistical activities to reduce duplication and reporting burden.

More information on Statistics Canada's mandate, roles, responsibilities and programs can be found in the 2026-2027 Main Estimates and in the Statistics Canada 2026-2027 Departmental Plan.

The Quarterly Financial Report:

  • should be read in conjunction with the 2026-2027 Main Estimates;
  • has been prepared by management, as required by Section 65.1 of the Financial Administration Act, and in the form and manner prescribed by Treasury Board of Canada Secretariat;
  • has not been subject to an external audit or review.

Statistics Canada has the authority to collect and spend revenue from other federal government departments and agencies, as well as from external clients, for statistical services and products.

Basis of presentation

This quarterly report has been prepared by management using an expenditure basis of accounting. The accompanying Statement of Authorities includes the agency's spending authorities granted by Parliament and those used by the agency consistent with the Main Estimates for the 2026-2027 fiscal year. This quarterly report has been prepared using a special purpose financial reporting framework designed to meet financial information needs with respect to the use of spending authorities.

The authority of Parliament is required before moneys can be spent by the Government. Approvals are given in the form of annually approved limits through appropriation acts or through legislation in the form of statutory spending authority for specific purposes.

The agency uses the full accrual method of accounting to prepare and present its annual departmental financial statements that are part of the departmental results reporting process. However, the spending authorities voted by Parliament remain on an expenditure basis.

B) Highlights of fiscal quarter and fiscal year-to-date results

This section highlights the significant items that contributed to the net increase in resources available for the year, as well as actual expenditures for the quarter ended June 30.

Chart 1 outlines the gross budgetary authorities, which represent the resources available for use for the year as of June 30.

Chart 1: Comparison of gross budgetary authorities and expenditures as of June 30, 2025, and June 30, 2026, in thousands of dollars

Significant changes to authorities

Total authorities available for 2026-27 have increased by $228.1 million, or 24.1%, from the previous year, from $947.9 million to $1.176 billion (Chart 1). The net increase is mostly the result of the following:

  • An increase of $300.7 million for the 2026 Census programs for new cyclical funding received to cover operational activities including Census collection;
  • An increase of $14.9 million for the Employee Benefit Plan adjustments and compensation funding related to collective agreements;
  • A decrease in $52.9 million for the Comprehensive Expenditure Review (CER) announced in Budget 2025;
  • A decrease of $25.9 million for cloud operations. Through the Spring Economic Update 2026, the Government announced an extension of this funding through 2028–29;
  • A decrease of $8 million for various initiatives including Canada's Action Plan on Combatting Hate and the Flood Risk Awareness Portal.

In addition to the appropriations allocated to the agency through the Main Estimates, Statistics Canada also has vote net authority within Vote 1, which entitles the agency to spend revenues collected from other federal government departments, agencies, and external clients to provide statistical services. The vote netting authority is stable at $120 million when comparing the first quarter of fiscal years 2025-2026 and 2026-2027.

Significant changes to expenditures

Year-to-date net expenditures recorded to the end of the first quarter increased by $189.5 million, or 96.8% from the previous year, from $195.8 million to $385.3 million (see Table A: Variation in Departmental Expenditures by Standard Object).

Statistics Canada spent approximately 36.5% of its authorities by the end of the first quarter, compared with 23.7% in the same quarter of 2025-2026.

Table A: Variation in Departmental Expenditures by Standard Object (unaudited)
Departmental Expenditures Variation by Standard Object:Q1 year-to-date variation between fiscal year 2025-2026 and 2026-2027
$'000%
(01) Personnel11,4846.1
(02) Transportation and communications53,6571,496.0
(03) Information4,923373.5
(04) Professional and special services121,1943,054.6
(05) Rentals2,04022.5
(06) Repair and maintenance32.5
(07) Utilities, materials and supplies-7-8.3
(08) Acquisition of land, buildings and works--
(09) Acquisition of machinery and equipment-390-87.1
(10) Transfer payments--
(12) Other subsidies and payments174118.5
Total gross budgetary expenditures193,07896.1
Less revenues netted against expenditures:
Revenues3,61834.9
Total net budgetary expenditures189,46096.8

Note: Explanations are provided for variances of more than $1 million.

Personnel: There is an overall increase in the agency's activities as the 2026 Censuses are in their main collection period this quarter. This increase in spending is partly offset by savings targets announced in Budget 2025 under the Comprehensive Expenditure Review (CER).

Transportation and communications: The increase is mainly due to postage costs for the mailing of Census materials as well as travel expenditures for enumerators for the 2026 Censuses collection activities occurring this fiscal year.

Information: The increase is mainly due to advertisement and printing costs for the 2026 Census materials such as questionnaires, envelopes, and letters.

Professional and special services: The increase is mainly due to the cost incurred for Statistics Act employees hired to conduct the 2026 Censuses.

Rentals: The increase is mainly due to additional costs for logistical requirements for the 2026 Censuses, as well as timing differences in invoicing compared to last year.

Revenues: The increase is mainly due to timing differences in invoicing compared to last year.

C) Significant changes to operations, personnel and programs

In 2026-27, the following changes in operations, personnel and program activities are underway:

  • The 2026 Census programs are currently underway. As a result, expenditures for this program are at their peak.
  • Funding for cloud infrastructure is not reflected in the authorities for 2026-27 since funding was originally set to end in 2025–26. However, through the Spring Economic Update 2026, the Government announced an extension of this funding through 2028–29. The associated funding is expected to be received by Statistics Canada during the 2026–27 fiscal year. As a result, the impact of this announced funding is not yet captured in the figures presented.
  • To support the implementation of the savings targets announced in Budget 2025 for the Comprehensive Expenditure Review, Statistics Canada will achieve these reductions through program realignment, targeted reductions and rescoping, and cost-saving efficiencies.

D) Risks and uncertainties

Statistics Canada continues to address financial and operational uncertainties through its integrated risk management framework.  Budget fluctuations related to cyclical programs, such as the Censuses, and anticipated impacts from the Comprehensive Expenditure Review are being managed through strong governance, disciplined financial management, and strategic resource allocation. At the same time, the agency continues to improve efficiency through automation, greater use of existing data sources and enhanced digital services. Strong partnerships across government and continued refinement of collaborative approaches are strengthening organizational resilience and supporting the efficient delivery of high-quality statistical information to Canadians.

Approval by senior officials

Approved by:

André Loranger
Chief Statistician
Ottawa, Ontario
Signed on: August 11, 2026

Martin Chapman
Acting Chief Financial Officer
Ottawa, Ontario
Signed on: July 30, 2026

Appendix

Statement of Authorities (unaudited)
 Fiscal year 2026-2027Fiscal year 2025–2026
Total available for use for the year ending March 31, 2027Footnote 1Used during the quarter ended June 30, 2026Year-to-date used at quarter-endTotal available for use for the year ending March 31, 2026Footnote 1Used during the quarter ended June 30, 2025Year-to-date used at quarter-end
in thousands of dollars
Vote 1 — Net operating expenditures945,509357,630357,630724,106169,851169,851
Statutory authority — Contribution to employee benefit plans110,52427,63127,631103,80625,95125,951
Total budgetary authorities1,056,033385,261385,261827,912195,802195,802
Departmental budgetary expenditures by Standard Object (unaudited)
 Fiscal year 2026-2027Fiscal year 2025–2026
Planned expenditures for the year ending March 31, 2027Expended during the quarter ended June 30, 2026Year-to-date used at quarter-endPlanned expenditures for the year ending March 31, 2026Expended during the quarter ended June 30, 2025Year-to-date used at quarter-end
in thousands of dollars
Expenditures:
(01) Personnel784,447198,919198,919782,276187,435187,435
(02) Transportation and communications107,58357,24457,24431,9943,5873,587
(03) Information24,5706,2416,24114,8651,3181,318
(04) Professional and special services218,207125,162125,16249,4473,9683,968
(05) Rentals27,06311,10411,10452,1899,0649,064
(06) Repair and maintenance1,3851281281,314125125
(07) Utilities, materials and supplies1,59682822,6868989
(08) Acquisition of land, buildings and works277--502--
(09) Acquisition of machinery and equipment9,60658588,983448448
(10) Transfer payments------
(12) Other subsidies and payments1,2993203203,656147147
Total gross budgetary expenditures1,176,033399,258399,258947,912206,181206,181
Less revenues netted against expenditures:
Revenues120,00013,99713,997120,00010,37910,379
Total revenues netted against expenditures120,00013,99713,997120,00010,37910,379
Total net budgetary expenditures1,056,033385,261385,261827,912195,802195,802

Statistics Canada's 2025–26 Departmental Results Report

On this page

Note: Statistics Canada used generative AI tools to support the development of content in this report. A human has reviewed and validated all AI-generated content.

At a glance

This departmental results report details Statistics Canada's actual accomplishments against the plans, priorities and expected results outlined in its 2025–26 Departmental Plan.

These results align with the priorities outlined in the May 21, 2025, mandate letter from the Prime Minister, as well as with Statistics Canada's vision, mission, raison d'être and operating context.

Key priorities

Statistics Canada identified the following key priorities for 2025–26:

  • Advance the agency's large-scale transformation agenda to deliver more integrated, timely and relevant data and insights for Canadians.
  • Deliver high-quality statistical programs and services to support evidence-based decision making and Government of Canada priorities.

Highlights

In 2025–26, Statistics Canada undertook major preparations for the 2026 Census of Population and Census of Agriculture, which provide foundational information for infrastructure planning, community services and agricultural development across Canada:

  • The 2026 Census of Population collected comprehensive demographic data, including information on new topics such as homelessness, general health and sexual orientation for Canadians aged 15 and older. Preparations in 2025–26 focused on ensuring the agency's systems, infrastructure and workforce were ready for this national undertaking.
  • The 2026 Census of Agriculture questionnaire content was finalized, and preparations were in place for the increased use of administrative data to improve efficiency, reduce respondent burden and maintain high-quality agricultural statistics.

In addition to census preparations, Statistics Canada advanced work to improve the availability, accessibility and relevance of statistical information for Canadians. The agency strengthened economic and social data programs through initiatives such as the Artificial Intelligence and Technology Measurement Program (TechStat), enhanced housing data to support understanding of affordability and supply, and expanded information on Canada's domestic and international economic connections. It also expanded access to data through secure platforms and continued its transformation agenda through the use of new technologies, including artificial intelligence and open-source tools. These efforts supported the agency's ability to provide timely, trusted information in a rapidly changing environment.

  • Total actual spending (including internal services): $811,685,256
  • Total full-time equivalent staff (including internal services): 6,689

For detailed information on Statistics Canada's total spending and human resources, read the Spending and human resources section of this report.

Summary of results

The following provides a summary of the results the department achieved in 2025–26 under its "core responsibility" (its main areas of activity).

Core responsibility: Statistical information

Actual spending: $717,724,847
Actual human resources: 6,028

In 2025–26, Statistics Canada delivered high-quality, timely and relevant statistical information to support evidence-based decision making for Canadians, businesses and governments. The agency strengthened its core economic and social data programs while advancing key transformation initiatives to improve how data are collected, integrated and analyzed.

The agency made significant progress in enhancing Canada's economic measurement framework. Updates to core national accounts improved the accuracy, coherence and international comparability of key economic indicators, such as gross domestic product (GDP), strengthening their use for fiscal, monetary and investment decision making. Statistics Canada releases highlighted major economic developments during the year, including annual GDP growth slowing to 1.7% in 2025 (The Daily — Gross domestic product, income and expenditure, fourth quarter 2025), inflation easing to 1.8% in early 2026 (The Daily — Consumer Price Index, February 2026) and record high exports to countries other than the United States, which rose to 5.7% in May 2025 (The Daily — Canadian international merchandise trade, May 2025). In response to external disruptions, Statistics Canada took targeted measures to sustain the timely release of critical economic statistics, ensuring decision makers continued to have reliable information when it was most needed. At the same time, new and expanded data on strategic sectors, such as internal trade and emerging technologies, provided timely and targeted insights into Canada's evolving economy, equipping decision makers to respond to emerging risks and opportunities for Canadians.

Complementing these efforts, social data were strengthened to reflect issues of importance to Canadians. Enhancements to housing data improved understanding of affordability and supply, informing housing policy and planning decisions. Health initiatives supported federal priorities, such as disease prevention and better knowledge of health system performance, enabling more effective monitoring and response. Improved labour force data collection and innovative approaches to respondent engagement ensured continued accuracy and representativeness of key labour market indicators, supporting workforce and economic decision making.

To support these advancements, Statistics Canada invested in innovation and transformation to sustain the quality and relevance of its programs. The agency expanded the use of administrative and alternative data sources and continued the adoption of modern statistical methods to address challenges such as declining response rates, reducing respondent burden and improving data coverage. Transitioning to open-source data processing environments increased flexibility, efficiency and transparency, enabling more agile development and faster deployment of statistical products. At the same time, artificial intelligence and innovative technologies were leveraged to accelerate analytical capabilities, streamline processes and support the broader transformation agenda. These efforts enabled faster insights and more responsive statistical production.

To ensure these improvements translated into greater impact, the agency strengthened connections with Canadians through a multifaceted approach that made data and statistics more accessible, engaging and relevant to diverse audiences. Expanded online platforms and dashboards, thematic content, and interactive tools increased access to key information and improved how users—from policy makers and researchers to the general public—navigate and apply data, supporting more informed decisions about economic, social and environmental issues.

For more information on Statistics Canada's activities related to statistical information, read the Results: What we achieved section of this report.

From the Minister

It is our pleasure to present the 2025–26 Departmental Results Report for Statistics Canada.

Every day, individuals, households, businesses and farms contribute data that, when transformed into trusted statistics, becomes a public good. These statistics help communities plan schools, hospitals and public transit, support businesses as they invest and create jobs, and enable governments to develop policies, allocate resources and deliver services that respond to the needs of Canadians. In this way, reliable information helps ensure decisions are grounded in evidence and contributes to a stronger, more resilient Canada.

To honour that contribution and ensure Canadians continue to benefit from the information they provide, Statistics Canada continued transforming how it produces and delivers statistics. By reducing respondent burden, accelerating analytical capabilities, expanding the use of artificial intelligence and innovative technologies, and strengthening international comparability the agency enhanced its ability to provide timely, high-quality information that supports decisions across Canada.

Statistics Canada also finalized preparations for the 2026 Census of Population and Census of Agriculture. By participating in these foundational programs, Canadians, households and agricultural operators help build a shared understanding of the country's changing population and economy. The information collected supports decisions about housing, health care, education, transportation, infrastructure and other services that affect communities across Canada.

We invite you to read this report to learn more about how Statistics Canada is working with partners across the country to support Canadian businesses, foster innovation and create opportunities for today and for future generations to come.

The Honourable Mélanie Joly

Minister of Industry and Minister responsible for Canada Economic Development for Quebec Regions

Headshot of The Honourable Mélanie Joly

The Honourable Mélanie Joly

Minister of Industry and Minister responsible for Canada Economic Development for Quebec Regions

From the Chief Statistician

In 2025–26, Statistics Canada continued to operate in a period of significant transformation. This moment in time is being shaped by rapid technological advances, evolving expectations for information, growing economic and social complexity, and fundamental changes in how people access, interpret and use data. These shifts are creating both opportunities and disruption, transforming how information is produced, shared and consumed across society.

In this context, the role of national statistics is becoming increasingly important. As both the volume of information continues to grow and the pace of change accelerates, Canadians expect information that is timely, accessible and trustworthy. Meeting these expectations requires national statistical organizations to continuously adapt while preserving the principles that underpin public confidence in official statistics.

Throughout the year, Statistics Canada continued transforming its statistical programs, methods, systems and ways of working to ensure the agency remains responsive, sustainable and relevant in a rapidly changing environment. This included preparations for the 2026 Census of Population and the 2026 Census of Agriculture, foundational programs that remain essential to understanding a changing Canada and supporting informed decisions in communities across the country.

At the same time, the agency advanced more integrated and automated approaches to statistical production, greater use of existing data sources, and more accessible digital information to better support Canadians' evolving information needs. These changes are also reshaping the nature of statistical work itself. Across the agency, employees continue to adapt to new technologies, new methods and new ways of collaborating to respond to increasingly complex issues and information needs. Their expertise, professionalism and commitment remain central to the agency's ability to innovate and deliver high-quality statistical information for Canadians.

As Statistics Canada evolves, maintaining public trust remains fundamental to its work. Trust is built through transparency, strong governance, ethical data practices, scientific integrity and meaningful engagement with Canadians. These principles will guide the agency as it prepares for the future.

Looking ahead, Statistics Canada will continue to evolve alongside the society it serves. This will require ongoing innovation, collaboration and strong stewardship to ensure Canada's statistical information remains relevant, inclusive and responsive in an increasingly dynamic world.

I invite you to read this report to learn more about the agency's results and accomplishments in 2025–26.

André Loranger

Chief Statistician of Canada

Headshot of André Loranger

André Loranger

Chief Statistician of Canada

Results: What we achieved

Core responsibilities and internal services

Core responsibility: Statistical information

Description

Statistics Canada's core responsibility is to produce objective, high-quality statistical information about Canada. The statistical information produced relates to the commercial, industrial, financial, social, economic, environmental, and general activities and conditions of the people of Canada.

The role of Statistics Canada as Canada's national statistical office

Canada is experiencing a socioeconomic transformation shaped by global trade dynamics, demographic shifts and rapid technological advances such as artificial intelligence (AI). While these changes present opportunities to increase productivity and reshape industries, they also introduce complex considerations relating to privacy, ethics and workforce adaptation. In this environment, Statistics Canada plays a critical role in providing timely, trusted data to support evidence-based decisions and help Canadians navigate change.

Statistics Canada's extensive suite of statistical programs provides essential insights into Canada's economy, society and environment, informing decisions that affect Canadians every day—from determining where schools and health facilities are built to monitoring food prices and preparing for emergencies. While most of the Agency's statistical programs support specific policy, legislative or information needs, five key programs are critical to shaping Canada's economic and social policies:

  • The Census of Population provides comprehensive data on Canada's population, supporting infrastructure planning and community services.
  • The Census of Agriculture provides detailed data on the agricultural sector, supporting agricultural policy, development and planning.
  • The Consumer Price Index measures inflation, informing fiscal policy and the Bank of Canada's monetary decisions.
  • The Labour Force Survey measures employment and labour market trends, supporting workforce planning and training policies.
  • The System of National Accounts provides a comprehensive view of economic activity, including gross domestic product, enabling analysis and decision making across government and industry.

Together, these programs reinforce Statistics Canada's role as Canada's national statistical office, providing the trusted information that underpins decision making across the country.

Building on this foundation, Statistics Canada continued to advance its mandate in 2025–26 while responding to a rapidly evolving environment.

Supporting the allocation of government funding

Statistics Canada's data play a key role in the allocation of federal funds to the provinces and territories. Under the Federal-Provincial Fiscal Arrangements Act, the agency provides population counts, national accounts data and other economic statistics that are used to determine annual transfer payments, guiding the distribution of more than $100 billion in funding for health care, education and other essential public services. National Accounts data also underpin the revenue allocation formula for the harmonized sales tax program.

In 2025–26, Statistics Canada carried out its mandate while advancing its transformation agenda. This agenda focused on delivering more connected, timely and trusted insights for Canadians, enabling rapid adaptation to emerging needs and supporting efficient and sustainable operations. These efforts were supported by a continued focus on fostering an inclusive and respectful workplace, ensuring employees were equipped to deliver results for Canadians.

Within this context, the agency maintained and strengthened its role as Canada's national statistical office by

  • contributing to statistical standards and practices
  • maintaining public trust in statistics
  • adapting to a rapidly evolving data environment
  • playing a key role in the international statistical system.

The following sections expand on how these roles were carried out in 2025–26:

  • Contributing to statistical standards and practices: Statistics Canada adhered to established standards and frameworks—such as the United Nations (UN) Fundamental Principles of Official Statistics (PDF)—ensuring credibility, data coherence and comparability over time. Within Canada, the agency continued to lead the 2023–2026 Data Strategy for the Federal Public Service, promoting sound data stewardship, secure and ethical data use, and high-quality statistical practices. Internationally, the agency contributed to the development and maintenance of global classification systems and supported initiatives such as the ongoing update of the Generic Statistical Business Process Model, led by the UN Economic Commission for Europe. These efforts ensure that Canadian statistics remain consistent, comparable, and aligned with international standards.
  • Maintaining public trust in statistics: Maintaining public trust remained central to Statistics Canada's mandate. In an environment where misinformation could erode confidence in public institutions, the agency upheld high standards of scientific integrity and ethics. As part of its transformation, it strengthened transparency through enhanced communications, website improvements and ongoing outreach via its Trust Centre. The development of the Countering Misinformation and Disinformation Strategy—including protocols to identify and address misinformation, enhanced social media monitoring, and increased public engagement on responsible data use—helped ensure that Canadians continue to have access to reliable, credible information. This work is complemented by collaboration with federal and international partners to share expertise and best practices.
  • Adapting to a rapidly evolving data environment: National statistical organizations are navigating a rapidly evolving environment marked by declining response rates, growing privacy concerns, increasing availability of big data and an expanding ecosystem of private data providers. Through its transformation agenda, Statistics Canada continued to adapt to this changing data landscape by adopting new methodologies, addressing emerging ethical considerations and strengthening partnerships across the data ecosystem. These efforts helped sustain data quality and relevance, ensuring Canadians continue to benefit from accurate and timely information.
  • Playing a key role in the international statistical system: Statistics Canada reinforced its international leadership through active participation in over 175 committees and expert groups, including but not limited to the UN Statistical Commission, the UN Economic Commission for Europe, and the Organisation for Economic Co-operation and Development (OECD). In June 2025, the Chief Statistician was elected chair of the Conference of European Statisticians, guiding the UN Economic Commission for Europe on key statistical matters. The Chief Statistician also serves as a member of the OECD Committee on Statistics and Statistical Policy, helping influence the direction of the organization's statistical program. The agency also contributed to advancing global statistical standards, including updates to the 2025 System of National Accounts, the Balance of Payments and International Investment Position Manual, and the UN System of Environmental-Economic Accounting. This work helps ensure that Canadian statistics remain internationally comparable and supports Canada's influence in shaping global statistical practices.

Through these efforts, Statistics Canada not only strengthened its data offerings to Canadians but also reinforced its role as a global leader in official statistics. By maintaining strong partnerships and contributing to global statistical standards, the agency enhanced the relevance, comparability and credibility of Canadian statistics and ensured decision makers have access to trusted, internationally aligned information.

Quality of life impacts

Statistics Canada's Quality of Life Statistics Program provides high-quality, timely data on well-being in Canada by bringing together information across a broad range of indicators. The program supports decision makers by delivering insights that inform policies and actions on the issues that matter most to Canadians.

In 2025–26, the program strengthened its role as a leading source of well-being data in Canada. Central to these efforts is the Quality of Life Hub, which underwent significant enhancements and continues to rank among the most-accessed resources on the Statistics Canada website.

Through the Quality of Life Statistics Program, Statistics Canada contributed to good governance by ensuring that public decisions are grounded in evidence, transparent and responsive to the lived experiences of Canadians. The program also supported federal departments in planning, decision making and reporting on Canada's Quality of Life Framework.

Progress on results

This section details the department's performance against its targets for each departmental result under Core responsibility: Statistical Information.

Table 1 shows the target, the date to achieve the target and the actual result for each indicator under high-quality statistical information is available to Canadians in the last three fiscal years.

Table 1: High-quality statistical information is available to Canadians

Departmental result indicators

Target

Date to achieve target

Actual results

Number of post-release corrections due to accuracy for mission critical programs

0

March 31, 2026

Percentage of international standards with which Statistics Canada conforms

90%

March 31, 2026

  • 2023–24: 99%
  • 2024–25: 99%
  • 2025–26: 99%

Number of statistical products available on the website

54,106

March 31, 2026

Number of Statistics Canada data tables available on the Open Data Portal

9,900

March 31, 2026

  • 2023–24: 9,373
  • 2024–25: 9,823
  • 2025–26: 10,152

Table 1 - footnote 1

In 2025–26, there were two post-release corrections related to accuracy in mission-critical programs. While this result exceeded the target of zero, it represents a 50% decrease in accuracy-related corrections compared with the previous fiscal year.

Table 1 - Return to footnote 1 referrer

Table 1 - footnote 1

In 2025–26, the result was 0.4% below the target, with 53,887 statistical products made available on the website compared with a target of 54,106, reflecting continued strong performance and sustained growth over time.

Table 1 - Return to footnote 2 referrer

Table 2 shows the target, the date to achieve the target and actual result for each indicator under high-quality statistical information is accessed by Canadians in the last three fiscal years.

Table 2: High-quality statistical information is accessed by Canadians

Departmental result indicators

Target

Date to achieve target

Actual results

Number of visits to Statistics Canada's website

31,500,000

March 31, 2026

Number of hits on Statistics Canada's Application Programming Interface (API)

23,765,544

March 31, 2026

  • 2023–24: 16,136,428
  • 2024–25: 22,995,048
  • 2025–26: 30,778,832

Percentage of website visitors that found what they were looking for

78%

March 31, 2026

Number of interactions on social media

1,300,000

March 31, 2026

Table 2 - footnote 1

Website visits to the Statistics Canada website were lower than anticipated in 2025–26. Forecasting website traffic is increasingly challenging because of evolving user behaviour, including changing public and media interest in key economic and social indicators and increased access through artificial intelligence tools, application programming interfaces and other machine-to-machine interactions.

Table 2 - Return to footnote 1 referrer

Table 2 - footnote 2

Results for the percentage of website visitors who "found what they were looking for" remained relatively stable in recent years. The target was adjusted from 78% to 75% in the 2026–27 Departmental Plan to better align with recent performance trends and current operating realities.

Table 2 - Return to footnote 2 referrer

Table 2 - footnote 3

Result reflects the implementation of new communication strategies to increase organic social media interactions, as well as the use of paid advertising to support recruitment activities for the 2026 Census.

Table 2 - Return to footnote 3 referrer

Table 3 shows the target, the date to achieve the target and actual result for each indicator under high-quality statistical information is relevant to Canadians in the last three fiscal years.

Table 3: High-quality statistical information is relevant to Canadians

Departmental result indicators

Target

Date to achieve target

Actual results

Number of media citations on Statistics Canada data

130,000

March 31, 2026

Number of journal citations

38,000

March 31, 2026

  • 2023–24: 44,042
  • 2024–25: 42,785
  • 2025–26: 38,089

Percentage of users satisfied with statistical information

80%

March 31, 2026

  • 2023–24: 88%
  • 2024–25: 92%
  • 2025–26: 91%

Table 3 - footnote 1

Media coverage declined in the third quarter of 2025–26 because of significant global events that shifted public and media attention away from Canada's economy. Coverage began to recover late in the fourth quarter.

Table 3 - Return to footnote 1 referrer

The Results section of the Infographic for Statistics Canada on GC Infobase provides additional information on results and performance related to its program inventory.

Details on results

The following section describes the results for statistical information in 2025–26 compared with the planned results set out in Statistics Canada's departmental plan for the year.

Key risks

Proactive risk monitoring enables Statistics Canada to remain responsive to changes in its operating environment that could affect its performance. Key risks relate to maintaining public trust, ensuring financial and organizational sustainability, protecting confidential information, and adapting statistical programs to evolving information needs. Early identification of risks supports timely and strategic action to reduce potential impacts on operations and maintain Canadians' trust. In 2025–26, the agency addressed key risks by strengthening governance, investing in its workforce and infrastructure, maintaining regular engagement with stakeholders, enhancing data linkages, and evolving the methods and systems used to produce statistical information. The following sections outline how these risks were managed over the reporting period.

1. Public trust

Maintaining public trust is essential to ensuring continued participation in Statistics Canada's statistical programs and use of its data and statistical information. This risk continued to be influenced by a challenging public trust environment, heightened expectations for transparency and privacy protection, and the increasing prevalence of misinformation and disinformation. The agency supported trust by upholding scientific integrity and ethical standards, communicating transparently through its Trust Centre, and proactively disclosing error corrections. It also continued to strengthen its infrastructure and methodologies to support reliable and relevant data and statistical outputs.

2. Financial sustainability

Financial sustainability is required to maintain statistical operations and respond to emerging data needs. The agency continued to manage financial pressures, including budget constraints, evolving priorities and the need to invest in programs, systems and operations while maintaining core statistical activities. In 2025–26, Statistics Canada strengthened financial management by improving key financial processes, developing new governing instruments such as the budget transfer directive, and aligning expenditures with operational priorities to support sound stewardship of public resources and fiscal discipline.

3. Organizational resilience

Organizational resilience depends on maintaining a skilled workforce and productive working environments that can adapt to ongoing changes in program delivery. Statistics Canada continued to invest in employee learning, upskilling and well-being to support workforce capacity. These efforts included training in evolving areas, such as data analysis, digital tools and the responsible use of new technologies. The agency also enhanced its physical and digital infrastructure, providing improved tools and workspaces to support program delivery. In parallel, Statistics Canada advanced accessibility, reconciliation and inclusion through initiatives that supported a barrier-free workplace, including the implementation of its Road to Accessibility plan.

4. Privacy and confidentiality

Protecting the privacy and confidentiality of information entrusted to Statistics Canada remains a fundamental responsibility and priority for the agency. Increasing cyber threats and the growing complexity of data environments continued to require strong safeguards for sensitive information. In 2025–26, the agency strengthened data protection using cloud-based infrastructure with enhanced access controls and continued application of established governance and safeguards, while promoting the use of de-identified data for analysis.

5. Relevance

Maintaining relevance requires adapting statistical programs to evolving information needs. This requires responding to rapidly changing user expectations, increasing demand for timely and detailed information, and a growing volume of data from diverse sources. In 2025–26, Statistics Canada expanded data and analysis on international trade, housing affordability and availability, and health care. This included new educational material on understanding the Canadian international merchandise trade balance, along with new products to support interpretation of emerging trends, helping to ensure statistical outputs remain aligned with the needs of decision makers and Canadians.

6. Accuracy

Ensuring accuracy is fundamental to the credibility of official statistics. Statistics Canada rigorously validated all new methods, such as the use of large language models in record linkage, which combines traditional statistical matching methods with AI-based approaches. It also ensured that methods followed the Quality Assurance Framework before implementation and continued to track, investigate and communicate errors in published data to ensure transparency and improve data quality over time.

While these actions strengthened the agency's ability to manage risks, ongoing pressures, such as declining response rates, evolving data needs and technological change, continue to require active monitoring and adaptation.

Resources required to achieve results

Table 4 provides a summary of the planned and actual spending and full-time equivalents required to achieve results.

Table 4: Snapshot of resources required for Statistical Information

Resource

Planned

Actual

Spending (net of respendable revenue)

$728,582,988

$717,724,847

Full-time equivalents (including respendable revenue)

6,762

6,028

The Finances section of the Infographic for Statistics Canada on GC Infobase page and the People section of the Infographic for Statistics Canada on GC Infobase page provide complete financial and human resources information related to its program inventory.

Related government priorities

This section highlights government priorities that are being addressed through this core responsibility.

Program inventory

Statistical information is supported by the following programs:

  • Economic and Environmental Statistics
  • Socioeconomic Statistics
  • Censuses
  • Cost-recovered Statistical Services
  • Centres of Expertise

Additional information related to the program inventory for statistical information is available on the Results section of the Infographic for Statistics Canada on GC InfoBase.

Internal services

Description

Internal services are the activities and resources that support a department in meeting its corporate obligations and delivering its programs. The 10 categories of internal services are:

  • acquisition management services
  • communications services
  • financial management services
  • human resources management services
  • information management services
  • information technology services
  • legal services
  • material management services
  • management and oversight services
  • real property management services

Progress on results

This section presents details on how the department performed to achieve results and meet targets for internal services.

Statistics Canada continues to strengthen its internal services to support a high-performing, inclusive and secure organization. These efforts focus on building a healthy, diverse and skilled workforce, strengthening digital capacity and maintaining strong governance and security practices. Collectively, they enable the agency to deliver trusted, high-quality statistical information efficiently, ensuring Canadians continue to have access to timely and reliable data to support decisions that affect their daily lives.

Progress on results

  • Strengthening workforce, inclusion and organizational culture
  • Expanding learning and workforce capacity
  • Advancing digital transformation and security

Strengthening workforce, inclusion and organizational culture

Statistics Canada is committed to fostering a healthy, diverse and inclusive workplace grounded in integrity and respect. In 2025–26, the agency updated and promoted its Code of Conduct and reinforced workplace processes to support a safe and respectful environment.

With the support of surveying and engagement activities, the agency continued to advance accessibility, reconciliation and inclusion through initiatives that support a barrier-free workplace. This includes implementing its Road to Accessibility plan and expanding opportunities for Indigenous language learning. The agency also continued to strengthen understanding of employee experiences through engagement and initiatives supporting equity-deserving groups.

Statistics Canada supported employee development and career growth through sponsorship and leadership programs that connect employees with senior leaders and strengthen advancement opportunities. Ongoing focus on employee well-being and engagement contributed to external recognition as one of Canada's Top 100 Employers in 2026.

Expanding learning and workforce capacity

Statistics Canada continued to strengthen employee skills and organizational capacity through a new structured learning framework focused on data, digital and analytical skills. This includes training in emerging areas, such as data analysis, digital tools and the responsible use of new technologies, such as AI.

The agency also supported leadership development and required Government of Canada training to ensure employees have the skills needed to support high-quality statistical operations. This contributes to a skilled and adaptable workforce capable of responding to evolving operational needs.

Advancing digital transformation and security

Statistics Canada is advancing its digital transformation to support efficient, secure and modern statistical operations. The agency developed an enterprise architecture framework to guide the evolution of its digital systems and launched new tools to streamline statistical processes, as well as internal processes, such as staffing, planning and budgeting.

In parallel, Statistics Canada strengthened its cyber security posture through ongoing improvements in risk management, system resilience and security awareness. These efforts help protect sensitive data and ensure the continuity of statistical operations.

Resources required to achieve results

Table 5 provides a summary of the planned and actual spending and full-time equivalents required to achieve results.

Table 5: Resources required for internal services for 2025–26

Resource

Planned

Actual

Spending (net of respendable revenue)

$99,325,542

$93,960,409

Full-time equivalents (including respendable revenue)

718

661

The Finances section of the Infographic for Statistics Canada on GC Infobase and the People section of the Infographic for Statistics Canada on GC Infobase provide complete financial and human resources information related to its program inventory.

Risk and compliance process

The Risk and Compliance Process (RCP) is a self-assessment designed to help deputy heads verify that they have controls and practices in place to meet their accountabilities under legislation and Treasury Board policy, and to effectively manage risks in their organizations.

In 2025–26, Statistics Canada completed the RCP self-assessment. The results show that the agency demonstrated appropriate practices and controls in all areas.

Contracts awarded to Indigenous businesses

Government of Canada departments are required to award at least 5% of the total value of contracts to Indigenous businesses every year.

As shown in Table 6, Statistics Canada awarded 6.61% of the total value of all contracts to Indigenous businesses for the fiscal year.

Table 6: Total value of contracts awarded to Indigenous businesses

Contracting performance indicator

2025–26 result

Total value of contracts awarded to Indigenous businesses (A)

$1,338,886.79

Total value of contracts awarded to Indigenous and non‑Indigenous businesses (B)

$81,747,842.22

Value of exceptions approved by deputy head (C)

$61,495,778.01

Proportion of contracts awarded to Indigenous businesses [A / (B−C) × 100]

6.61%

Notes

For the purposes of the minimum 5% target, Indigenous Services Canada defines "Indigenous businesses" as:

  • businesses owned and operated by Elders, band and tribal councils
  • businesses registered in the Government of Canada's Indigenous Business Directory
  • registered on a modern treaty beneficiary business list

A "contract" is a binding agreement for the procurement of a good, service or construction and does not include real property leases. It includes contract amendments and contracts entered into by means of acquisition cards of more than $10,000.

Statistics Canada's deputy head has approved exclusions for certain commodities in the calculation of the Indigenous procurement results. These include an exclusion of $41 million for cloud services in 2025–2026 because the cloud services framework did not include an Indigenous-owned supplier and a one-time exclusion of $13 million related to the advertising campaign for the 2026 Census of Population, for which the Government of Canada's agency of record is not Indigenous owned. An exclusion was also applied to software licensing, since specific proprietary solutions are required to support business objectives, including the Census of Population, and are constrained by intellectual property and interoperability requirements. Collectively, these commodities represented a substantial monetary value and contributed to meeting the overall target. 

Statistics Canada has exceeded its established targets and remains committed to fostering Indigenous participation in federal contracting. The agency will continue to promote inclusion by inviting Indigenous-owned businesses to participate in competitive processes, including the use of conditional set-aside opportunities. Additionally, teams across the organization will collaborate to share challenges, successes and best practices, further strengthening efforts to enhance Indigenous representation in procurement activities.

In its 2026–27 Departmental Plan, Statistics Canada estimated that it would award 5.71% of the total value of its contracts to Indigenous businesses by the end of 2025–26. Statistics Canada exceeded it planned targets because of a combination of strategic and operational factors. These included more frequent invitation of suppliers identified through the Indigenous Business Directory and supported by procurement planning and engagement with program managers.

Spending and human resources

Spending

This section presents an overview of the department's actual and planned expenditures from 2023–24 to 2028–29.

Budgetary performance summary

Table 7 shows the money that Statistics Canada spent in each of the past three years on its core responsibilities and on internal services.

Table 7: Actual three-year spending on core responsibilities and internal services (dollars)

Core responsibilities and internal services

2025–26 Main Estimates

2025–26 total authorities available for use

Actual spending over three years (authorities used)

Statistical information

848,582,988

877,710,994

  • 2023–24: 784,946,138
  • 2024–25: 763,566,349
  • 2025–26: 828,773,926

Internal services

99,325,542

99,006,734

  • 2023–24: 88,762,478
  • 2024–25: 99,113,781
  • 2025–26: 94,085,240

Total gross

947,908,530

976,717,728

  • 2023–24: 873,708,616
  • 2024–25: 862,680,130
  • 2025–26: 922,859,166

Respendable revenue

-120,000,000

-120,000,000

  • 2023–24: -132,999,612
  • 2024–25: -128,407,475
  • 2025–26: -111,173,910

Total net

827,908,530

856,717,728

  • 2023–24: 740,709,004
  • 2024–25: 734,272,655
  • 2025–26: 811,685,256

The Finances section of the Infographic for Statistics Canada on GC Infobase provides more financial information from previous years.

Planned spending for next three years

Table 8 shows Statistics Canada's planned spending for each of the next three years on its core responsibilities and on internal services.

Table 8: Planned three-year spending on core responsibilities and internal services (dollars)

Core responsibilities and internal services

2026–27 planned spending

2027–28 planned spending

2028–29 planned spending

Statistical information

1,090,488,458

678,005,501

577,720,384

Internal services

85,539,271

81,968,939

75,888,781

Total gross

1,176,027,729

759,974,440

653,609,165

Respendable revenue

-120,000,000

-120,000,000

-120,000,000

Total net

1,056,027,729

639,974,440

533,609,165

The Finances section of the Infographic for Statistics Canada on GC Infobase provides more detailed financial information related to future years.

Budgetary actual gross spending

Table 9 reconciles gross planned spending with net spending for 2025–26.

Table 9: Budgetary actual gross spending summary (dollars)

Core responsibilities and internal services

2025–26 actual gross spending

2025–26 actual revenues netted against expenditures

2025–26 actual net spending (authorities used)

Statistical information

828,773,926

-111,049,079

717,724,847

Internal services

94,085,240

-124,831

93,960,409

Total

922,859,166

-111,173,910

811,685,256

The Finances section of the Infographic for Statistics Canada on GC Infobase provides information on the alignment of Statistics Canada's spending with Government of Canada's spending and activities.

Funding

This section provides an overview of the department's voted and statutory funding for its core responsibilities and for internal services.

Graph 1 summarizes the department's approved voted and statutory funding from 2023–24 to 2028–29.

Graph 1: Approved funding (statutory and voted) over a six-year period

Consult the Public Accounts of Canada for further information on Statistics Canada's departmental voted and statutory expenditures.

Financial statement highlights

This section presents Statistics Canada's Financial statements (Unaudited) for the year ended March 31, 2026.

Table 10 summarizes the expenses and revenues for 2025–26, which net to the cost of operations before government funding and transfers.

Table 10: Condensed Statement of Operations (unaudited) for the year ended March 31, 2026 (dollars)

Financial information

2025–26 actual results

2025–26 planned results

Difference (actual results minus planned)

Total expenses

1,024,380,396

1,128,270,699

-103,890,303

Total revenues

110,231,414

120,000,000

-9,768,586

Net cost of operations before government funding and transfers

914,148,982

1,008,270,699

-94,121,717

For more information on the distribution of expenses by program and type, please see the two charts below.

Graph 2: Gross expenditures by core responsibility

Total expenses, including services provided without charge by federal government departments, were $1,024.4 million in 2025-26. These expenses comprised $921.1 million (89.9%) for Statistical Information and $103.3 million (10.1%) for internal services.

Graph 3: Gross expenditures by type

Statistics Canada spent $1,024.4 million in 2025-26. These expenses mainly comprised $829 million (80.9%) for salaries and employee benefits; $47.7 million (4.7%) for rentals; $42.3 million (4.1%) for accommodations; $33.7 million (3.3%) for professional and special services; $33.4 million (3.3%) for transportation, communication and postage; and $27.4 million (2.7%) for amortization. Other operating expenditures comprised $10.9 million (1%) for information, repairs and maintenance, materials and supplies.

The 2025–26 planned results information is provided in Statistics Canada's Future-Oriented Statement of Operations and Notes 2025–26.

Table 11 summarizes actual expenses and revenues and shows the net cost of operations before government funding and transfers.

Table 11: Condensed Statement of Operations (unaudited) for 2024–25 and 2025–26 (dollars)

Financial information

2025–26 actual results

2024–25 actual results

Difference (2025–26 minus 2024–25)

Total expenses

1,024,380,396

964,678,418

59,701,978

Total revenues

110,231,414

128,238,953

-18,007,539

Net cost of operations before government funding and transfers

914,148,982

836,439,465

77,709,517

Table 12 provides a brief snapshot of the amounts the department owes or must spend (liabilities) and its available resources (assets), which helps to indicate its ability to carry out programs and services.

Table 12: Condensed Statement of Financial Position (unaudited) as at March 31, 2026 (dollars)

Financial information

Actual fiscal year (2025–26)

Previous fiscal year (2024–25)

Difference (2025–26 minus 2024–25)

Total net liabilities

164,108,531

147,116,377

16,992,154

Total net financial assets

111,866,253

75,762,161

36,104,092

Departmental net debt

52,242,278

71,354,216

-19,111,938

Total non-financial assets

117,311,452

131,653,553

-14,342,101

Departmental net financial position

65,069,174

60,299,337

4,769,837

For more information on the distribution of the balances in the statements of financial position, please see the two charts below.

Graph 4: Assets by type

Total assets, including financial and non-financial assets, were $229.2 million at the end of 2025-26. Tangible capital assets represented the largest portion of assets, at $111.9 million (48.8%). They consisted of informatics software ($69.6 million), software under development ($25.9 million), leasehold improvements ($11.1 million) and other assets ($5.3 million). The remaining portion comprised $105.8 million (46.2%) for amounts due from the Consolidated Revenue Fund, $6 million (2.6%) for accounts receivable and advances, $3.9 million (1.7%) for prepaid expenses, and $1.6 million (0.7%) for consumable supplies.

Graph 5: Liabilities by type

Total liabilities were $164.1 million at the end of 2025-26. Accounts payable and accrued liabilities made up the largest portion of liabilities, at $109.3 million (66.6%). They consisted of accrued salaries and wages ($72.2 million), accounts payable to external parties ($32.8 million), and accounts payable to other federal government departments and agencies ($4.3 million). The next largest portion was vacation pay and compensatory leave, at $41.5 million (25.3%). Employee future benefits made up $12.9 million (7.8%). The remaining portion was composed of deferred revenue, at $0.4 million (0.3%).

Human resources

This section presents an overview of the department's actual and planned human resources from 2023–24 to 2028–29.

Table 13 shows a summary in full-time equivalents of human resources for Statistics Canada's core responsibilities and for its internal services for the previous three fiscal years.

Table 13: Actual human resources for core responsibilities and internal services for the last three years

Core responsibilities and internal services

2023–24 actual full-time equivalents

2024–25 actual full-time equivalents

2025–26 actual full-time equivalents

Statistical information

6,291

6,075

6,028

Internal services

619

685

661

Total gross

6,910

6,760

6,689

Respendable revenue

-1,373

-1,267

-992

Total net

5,537

5,493

5,697

Table 14 shows the planned full-time equivalents for each of Statistics Canada's core responsibilities and for its internal services for the next three years. Human resources for the current fiscal year are forecast based on year to date.

Table 14: Human resources planning summary for core responsibilities and internal services for the next three years

Core responsibilities and internal services

2026–27 planned full-time equivalents

2027–28 planned full-time equivalents

2028–29 planned full-time equivalents

Statistical information

6,692

5,756

4,984

Internal services

601

576

532

Total gross

7,293

6,332

5,516

Respendable revenue

-1,164

-1,164

-1,164

Total net

6,129

5,168

4,352

Supplementary information tables

The following supplementary information tables are available on Statistics Canada's website:

Federal tax expenditures

The tax system can be used to achieve public policy objectives through the application of special measures such as low tax rates, exemptions, deductions, deferrals and credits. The Department of Finance Canada publishes cost estimates and projections for these measures each year in the Report on Federal Tax Expenditures. This report also provides detailed background information on tax expenditures, including descriptions, objectives, historical information and references to related federal spending programs as well as evaluations and GBA Plus of tax expenditures.

Corporate information

Definitions

Annual Exploration, Development and Capital Expenditures Survey: Petroleum and Natural Gas Industry - Preliminary Estimate for 2026 and Intentions for 2027

Why are we conducting this survey?

This survey collects data on capital expenditures in Canada. The information is used by federal and provincial government departments and agencies, trade associations, universities and international organizations for policy development and as a measure of regional economic activity.

Your information may also be used by Statistics Canada for other statistical and research purposes.

Your participation in this survey is required under the authority of the Statistics Act.

Other important information

Authorization to collect this information

Data are collected under the authority of the Statistics Act, Revised Statutes of Canada, 1985, Chapter S-19.

Confidentiality

By law, Statistics Canada is prohibited from releasing any information it collects that could identify any person, business, or organization, unless consent has been given by the respondent, or as permitted by the Statistics Act. Statistics Canada will use the information from this survey for statistical purposes only.

Record linkages

To enhance the data from this survey and to reduce the reporting burden, Statistics Canada may combine the acquired data with information from other surveys or from administrative sources.

Data-sharing agreements

To reduce respondent burden, Statistics Canada has entered into data-sharing agreements with provincial and territorial statistical agencies and other government organizations, which have agreed to keep the data confidential and use them only for statistical purposes. Statistics Canada will only share data from this survey with those organizations that have demonstrated a requirement to use the data.

Section 11 of the Statistics Act provides for the sharing of information with provincial and territorial statistical agencies that meet certain conditions. These agencies must have the legislative authority to collect the same information, on a mandatory basis, and the legislation must provide substantially the same provisions for confidentiality and penalties for disclosure of confidential information as the Statistics Act. Because these agencies have the legal authority to compel businesses to provide the same information, consent is not requested and businesses may not object to the sharing of the data.

For this survey, there are Section 11 agreements with the provincial and territorial statistical agencies of Newfoundland and Labrador, Nova Scotia, New Brunswick, Quebec, Ontario, Manitoba, Saskatchewan, Alberta, British Columbia, and the Yukon. The shared data will be limited to information pertaining to business establishments located within the jurisdiction of the respective province or territory.

Section 12 of the Statistics Act provides for the sharing of information with federal, provincial or territorial government organizations. Under Section 12, you may refuse to share your information with any of these organizations by writing a letter of objection to the Chief Statistician, specifying the organizations with which you do not want Statistics Canada to share your data and mailing it to the following address:

Chief Statistician of Canada
Statistics Canada
Attention of Director, Enterprise Statistics Division
150 Tunney’s Pasture Driveway
Ottawa, Ontario
K1A 0T6

You may also contact us by email at statcan.esd-helpdesk-dse-bureaudedepannage.statcan@canada.ca- this link will open in a new window or by fax at 613-951-6583.

For this survey, there are Section 12 agreements with the statistical agencies of Prince Edward Island, the Northwest Territories and Nunavut as well as Environment and Climate Change Canada, Infrastructure Canada, the Canada Energy Regulator, Natural Resources Canada and Sustainability Development Technology Canada.

For agreements with provincial and territorial government organizations, the shared data will be limited to information pertaining to business establishments located within the jurisdiction of the respective province or territory.

Business or organization and contact information

1. Verify or provide the business or organization's legal and operating name and correct where needed.

Note: Legal name modifications should only be done to correct a spelling error or typo.

Legal Name

The legal name is one recognized by law, thus it is the name liable for pursuit or for debts incurred by the business or organization. In the case of a corporation, it is the legal name as fixed by its charter or the statute by which the corporation was created.

Modifications to the legal name should only be done to correct a spelling error or typo.

To indicate a legal name of another legal entity you should instead indicate it in question 3 by selecting 'Not currently operational' and then choosing the applicable reason and providing the legal name of this other entity along with any other requested information.

Operating Name

The operating name is a name the business or organization is commonly known as if different from its legal name. The operating name is synonymous with trade name.

Legal name

Operating name (if applicable)

2. Verify or provide the contact information of the designated business or organization contact person for this questionnaire and correct where needed.

Note: The designated contact person is the person who should receive this questionnaire. The designated contact person may not always be the one who actually completes the questionnaire.

First name

Last name

Title

Preferred language of communication

  • English
  • French

Mailing address (number and street)

City

Province, territory or state

Postal code or ZIP (Zone Improvement Plan) code
Example: A9A 9A9 or 12345-1234

Country
  • Afghanistan
  • Åland Islands
  • Albania
  • Algeria
  • American Samoa
  • Andorra
  • Angola
  • Anguilla
  • Antarctica
  • Antigua and Barbuda
  • Argentina
  • Armenia
  • Aruba
  • Australia
  • Austria
  • Azerbaijan
  • Bahamas
  • Bahrain
  • Bangladesh
  • Barbados
  • Belarus
  • Belgium
  • Belize
  • Benin
  • Bermuda
  • Bhutan
  • Bolivia
  • Bonaire, Sint Eustatius and Saba
  • Bosnia and Herzegovina
  • Botswana
  • Bouvet Island
  • Brazil
  • British Indian Ocean Territory
  • Brunei Darussalam
  • Bulgaria
  • Burkina Faso
  • Burma (Myanmar)
  • Burundi
  • Cambodia
  • Cameroon
  • Canada
  • Cape Verde
  • Cayman Islands
  • Central African Republic
  • Chad
  • Chile
  • China
  • Christmas Island
  • Cocos (Keeling) Islands
  • Colombia
  • Comoros
  • Congo, Republic of the
  • Congo, The Democratic Republic of the
  • Cook Islands
  • Costa Rica
  • Côte d'Ivoire
  • Croatia
  • Cuba
  • Curaçao
  • Cyprus
  • Czech Republic
  • Denmark
  • Djibouti
  • Dominica
  • Dominican Republic
  • Ecuador
  • Egypt
  • El Salvador
  • Equatorial Guinea
  • Eritrea
  • Estonia
  • Ethiopia
  • Falkland Islands (Malvinas)
  • Faroe Islands
  • Fiji
  • Finland
  • France
  • French Guiana
  • French Polynesia
  • French Southern Territories
  • Gabon
  • Gambia
  • Georgia
  • Germany
  • Ghana
  • Gibraltar
  • Greece
  • Greenland
  • Grenada
  • Guadeloupe
  • Guam
  • Guatemala
  • Guernsey
  • Guinea
  • Guinea-Bissau
  • Guyana
  • Haiti
  • Heard Island and McDonald Islands
  • Holy See (Vatican City State)
  • Honduras
  • Hong Kong Special Administrative Region
  • Hungary
  • Iceland
  • India
  • Indonesia
  • Iran
  • Iraq
  • Ireland, Republic of
  • Isle of Man
  • Israel
  • Italy
  • Jamaica
  • Japan
  • Jersey
  • Jordan
  • Kazakhstan
  • Kenya
  • Kiribati
  • Korea, North
  • Korea, South
  • Kosovo
  • Kuwait
  • Kyrgyzstan
  • Laos
  • Latvia
  • Lebanon
  • Lesotho
  • Liberia
  • Libya
  • Liechtenstein
  • Lithuania
  • Luxembourg
  • Macao Special Administrative Region
  • Macedonia, Republic of
  • Madagascar
  • Malawi
  • Malaysia
  • Maldives
  • Mali
  • Malta
  • Marshall Islands
  • Martinique
  • Mauritania
  • Mauritius
  • Mayotte
  • Mexico
  • Micronesia, Federated States of
  • Moldova
  • Monaco
  • Mongolia
  • Montenegro
  • Montserrat
  • Morocco
  • Mozambique
  • Namibia
  • Nauru
  • Nepal
  • Netherlands
  • New Caledonia
  • New Zealand
  • Nicaragua
  • Niger
  • Nigeria
  • Niue
  • Norfolk Island
  • Northern Mariana Islands
  • Norway
  • Oman
  • Pakistan
  • Palau
  • Panama
  • Papua New Guinea
  • Paraguay
  • Peru
  • Philippines
  • Pitcairn
  • Poland
  • Portugal
  • Puerto Rico
  • Qatar
  • Réunion
  • Romania
  • Russian Federation
  • Rwanda
  • Saint Barthélemy
  • Saint Helena
  • Saint Kitts and Nevis
  • Saint Lucia
  • Saint Martin (French part)
  • Saint Pierre and Miquelon
  • Saint Vincent and the Grenadines
  • Samoa
  • San Marino
  • Sao Tome and Principe
  • Sark
  • Saudi Arabia
  • Senegal
  • Serbia
  • Seychelles
  • Sierra Leone
  • Singapore
  • Sint Maarten (Dutch part)
  • Slovakia
  • Slovenia
  • Solomon Islands
  • Somalia
  • South Africa, Republic of
  • South Georgia and the South Sandwich Islands
  • South Sudan
  • Spain
  • Sri Lanka
  • Sudan
  • Suriname
  • Svalbard and Jan Mayen
  • Swaziland
  • Sweden
  • Switzerland
  • Syria
  • Taiwan
  • Tajikistan
  • Tanzania
  • Thailand
  • Timor-Leste
  • Togo
  • Tokelau
  • Tonga
  • Trinidad and Tobago
  • Tunisia
  • Turkey
  • Turkmenistan
  • Turks and Caicos Islands
  • Tuvalu
  • Uganda
  • Ukraine
  • United Arab Emirates
  • United Kingdom
  • United States
  • United States Minor Outlying Islands
  • Uruguay
  • Uzbekistan
  • Vanuatu
  • Venezuela
  • Viet Nam
  • Virgin Islands, British
  • Virgin Islands, United States
  • Wallis and Futuna
  • West Bank and Gaza Strip (Palestine)
  • Western Sahara
  • Yemen
  • Zambia
  • Zimbabwe

Email address
Example: user@example.gov.ca

Telephone number (including area code)
Example: 123-123-1234

Extension number (if applicable)

Fax number (including area code)
Example: 123-123-1234

3. Verify or provide the current operational status of the business or organization identified by the legal and operating name above.

  • Operational
  • Not currently operational
  • e.g., (for example) temporarily or permanently closed, change of ownership

Why is this business or organization not currently operational?

  • Seasonal operations
  • Ceased operations
  • Sold operations
  • Amalgamated with other businesses or organizations
  • Temporarily inactive but will re-open
  • No longer operating due to other reasons

When did this business or organization close for the season?

  • Date
    Example: YYYY-MM-DD

When does this business or organization expect to resume operations?

  • Date
    Example: YYYY-MM-DD

When did this business or organization cease operations?

  • Date
    Example: YYYY-MM-DD

Why did this business or organization cease operations?

  • Bankruptcy
  • Liquidation
  • Dissolution
  • Other

Specify the other reasons why the operations ceased.

When was this business or organization sold?

  • Date
    Example: YYYY-MM-DD

What is the legal name of the buyer?

When did this business or organization amalgamate?

  • Date
    Example: YYYY-MM-DD

What is the legal name of the resulting or continuing business or organization?

What are the legal names of the other amalgamated businesses or organizations?

When did this business or organization become temporarily inactive?

  • Date
    Example: YYYY-MM-DD

When does this business or organization expect to resume operations?

  • Date
    Example: YYYY-MM-DD

Why is this business or organization temporarily inactive?

When did this business or organization cease operations?

  • Date
    Example: YYYY-MM-DD

Why did this business or organization cease operations?

4. Verify or provide the current main activity of the business or organization identified by the legal and operating name above.

Note: The described activity was assigned using the North American Industry Classification System (NAICS).

This question verifies the business or organization's current main activity as classified by the North American Industry Classification System (NAICS). The North American Industry Classification System (NAICS) is an industry classification system developed by the statistical agencies of Canada, Mexico and the United States. Created against the background of the North American Free Trade Agreement, it is designed to provide common definitions of the industrial structure of the three countries and a common statistical framework to facilitate the analysis of the three economies. NAICS is based on supply-side or production-oriented principles, to ensure that industrial data, classified to NAICS , are suitable for the analysis of production-related issues such as industrial performance.

The target entity for which NAICS is designed are businesses and other organizations engaged in the production of goods and services. They include farms, incorporated and unincorporated businesses and government business enterprises. They also include government institutions and agencies engaged in the production of marketed and non-marketed services, as well as organizations such as professional associations and unions and charitable or non-profit organizations and the employees of households.

The associated NAICS should reflect those activities conducted by the business or organizational units targeted by this questionnaire only, as identified in the 'Answering this questionnaire' section and which can be identified by the specified legal and operating name. The main activity is the activity which most defines the targeted business or organization's main purpose or reason for existence. For a business or organization that is for-profit, it is normally the activity that generates the majority of the revenue for the entity.

The NAICS classification contains a limited number of activity classifications; the associated classification might be applicable for this business or organization even if it is not exactly how you would describe this business or organization's main activity.

Please note that any modifications to the main activity through your response to this question might not necessarily be reflected prior to the transmitting of subsequent questionnaires and as a result they may not contain this updated information.

The following is the detailed description including any applicable examples or exclusions for the classification currently associated with this business or organization.

Description and examples

  • This is the current main activity
  • This is not the current main activity

Provide a brief but precise description of this business or organization's main activity.

e.g. , breakfast cereal manufacturing, shoe store, software development

Main activity

5. You indicated that is not the current main activity.

Was this business or organization's main activity ever classified as:?

  • Yes
    • When did the main activity change?
      • Date
  • No

6. Search and select the industry classification code that best corresponds to this business or organization's main activity.

How to search:

  • if desired, you can filter the search results by first selecting this business or organization's activity sector
  • enter keywords or a brief description that best describes this business or organization main activity
  • press the Search button to search the database for an activity that best matches the keywords or description you provided
  • then select an activity from the list.

Select this business or organization's activity sector (optional)

  • Farming or logging operation
  • Construction company or general contractor
  • Manufacturer
  • Wholesaler
  • Retailer
  • Provider of passenger or freight transportation
  • Provider of investment, savings or insurance products
  • Real estate agency, real estate brokerage or leasing company
  • Provider of professional, scientific or technical services
  • Provider of health care or social services
  • Restaurant, bar, hotel, motel or other lodging establishment
  • Other sector

Reporting period information

1. What are the start and end dates of this organization's 2026 fiscal year?

Note: For this survey, the end date should fall between April 1, 2026 and March 31, 2026.

Here are twelve common fiscal periods that fall within the targeted dates:

  • May 1, 2025 to April 30, 2026
  • June 1, 2025 to May 31, 2026
  • July 1, 2025 to June 30, 2026
  • August 1, 2025 to July 31, 2026
  • September 1, 2025 to August 31, 2026
  • October 1, 2025 to September 30, 2026
  • November 1, 2025 to October 31, 2026
  • December 1, 2025 to November 30, 2026
  • January 1, 2026 to December 31, 2026
  • February 1, 2026 to January 31, 2027
  • March 1, 2026 to February 28, 2027
  • April 1, 2026 to March 31, 2027.

Here are other examples of fiscal periods that fall within the required dates:

  • September 18, 2025 to September 15, 2026 (e.g., floating year-end)
  • June 1, 2026 to December 31, 2026 (e.g., a newly opened business).

Fiscal Year Start
Example: YYYY-MM-DD

  • Date

Fiscal Year-End
Example: YYYY-MM-DD

  • Date

2. What is the reason the reporting period does not cover a full year?

Select all that apply.

Seasonal operations

New business

Change of ownership

Temporarily inactive

Change of fiscal year

Ceased operations

Other reason - specify:

Additional reporting instructions

3. Throughout this questionnaire, please report financial information in thousands of Canadian dollars.

For example, an amount of $763,880.25 should be reported as:

CAN$ '000

I will report in the format above.

Capital Expenditures - Preliminary Estimate 2026

4. For the fiscal year 2026, what are this organization's preliminary estimates for capital expenditures?

Include: all capitalized overhead and capitalized interest.

  • When there are partnerships and joint venture activities or projects, report the expenditures reflecting this corporation's net interest in such projects or ventures.
  • Report all dollar amounts in thousands of Canadian dollars ('000).
  • Exclude sales tax.
  • When precise figures are not available, please provide your best estimates.

If there are no capital expenditures, please enter '0'.

A. Oil and gas rights acquisition and retention costs (exclude inter-company sales or transfers):

Include acquisition costs and fees for oil and gas rights (include bonuses, legal fees and filing fees), and oil and gas retention costs.

B. Exploration and evaluation, capitalized or expensed ( e.g. , leases and licences, seismic, exploration drilling):

These expenditures include mineral rights fees and retention costs, geological, geophysical and seismic expenses, exploration drilling, and other costs incurred during the reporting period in order to determine whether oil or gas reserves exist and can be exploited commercially. Report gross expenditures, before deducting any incentive grants, incurred for oil and gas activities on a contracted basis and/or by your own employees. Exclude the cost of land acquired from other oil and gas companies.

C. Building construction ( e.g. , process building, office building, camp, storage building, and maintenance garage):

Include capital expenditures on buildings such as office buildings, camps, warehouses, maintenance garages, workshops, and laboratories. Fixtures, facilities and equipment that are integral parts of the building are included.

D. Other construction assets ( e.g. , development drilling and completions, processing facilities, natural gas plants, upgraders):

Include all infrastructure, other than buildings, such as the cost of well pads, extraction and processing infrastructure and plants, upgrading units, transportation infrastructure, water and sewage infrastructure, tailings, pipelines and wellhead production facilities (pumpjacks, separators, etc. ). Include all preconstruction planning and design costs such as development drilling, regulatory approvals, environmental assessments, engineering and consulting fees and any materials supplied to construction contractors for installation, as well as site clearance and preparation. Equipment which is installed as an integral or built-in feature of a fixed structure ( e.g. , casings, tanks, steam generators, pumps, electrical apparatus, separators, flow lines, etc. ) should be reported with the construction asset; however, when the equipment is replaced within an existing structure, the replacement cost should be reported in machinery and equipment (sustaining capital).

E. Machinery and equipment purchases ( e.g. , trucks, shovels, computers, etc. ):

Include transportation equipment for people and materials, computers, software, communication equipment, and processing equipment not included in the above categories.

Preliminary Estimate

 2026 Preliminary Estimate ( CAN$ '000 )
Oil and gas rights acquisitions and retention costs 
Exploration and evaluation 
Non-residential building construction 
Development and other construction 
Machinery and equipment 
Total 

Total

Research and Development

5. For the fiscal year 2026, did this organization perform scientific research and development in Canada of at least $10,000 or outsource (contract-out) to another organization scientific research and development activities of at least $10,000?

Research and experimental development (R&D) comprise creative and systematic work undertaken in order to increase the stock of knowledge - including knowledge of humankind, culture and society - and to devise new applications of available knowledge. For an activity to be an R&D activity, it must satisfy five core criteria:

  1. To be aimed at new findings (novel);
  2. To be based on original, not obvious, concepts and hypothesis (creative);
  3. To be uncertain about the final outcome (uncertainty);
  4. To be planned and budgeted (systematic);
  5. To lead to results to could be possibly reproduced (transferable/ or reproducible).

The term R&D covers three types of activity: basic research, applied research and experimental development. Basic research is experimental or theoretical work undertaken primarily to acquire new knowledge of the underlying foundations of phenomena and observable facts, without any particular application or use in view. Applied research is original investigation undertaken in order to acquire new knowledge. It is, however, directed primarily towards a specific, practical aim or objective. Experimental development is systematic work, drawing on knowledge gained from research and practical experience and producing additional knowledge, which is directed to producing new products or processes or to improving existing products or processes.

  • Yes
  • No

Capital Expenditures - Intentions 2027

6. For the fiscal year 2027, what are this organization's intentions for capital expenditures?

Include: all capitalized overhead and capitalized interest.

  • When there are partnerships and joint venture activities or projects, report the expenditures reflecting this corporation's net interest in such projects or ventures.
  • Report all dollar amounts in thousands of Canadian dollars ('000).
  • Do not include sales tax.
  • Percentages should be rounded to whole numbers.
  • When precise figures are not available, please provide your best estimates.

If there are no capital expenditures, please enter '0'.

A. Oil and gas rights acquisition and retention costs (exclude inter-company sales or transfers):

Include acquisition costs and fees for oil and gas rights (include bonuses, legal fees and filing fees), and oil and gas retention costs

B. Exploration and evaluation, capitalized or expensed ( e.g. , leases and licences, seismic, exploration drilling):

These expenditures include mineral rights fees and retention costs, geological, geophysical and seismic expenses, exploration drilling, and other costs incurred during the reporting period in order to determine whether oil or gas reserves exist and can be exploited commercially. Report gross expenditures, before deducting any incentive grants, incurred for oil and gas activities on a contracted basis and/or by your own employees. Exclude the cost of land acquired from other oil and gas companies.

C. Building construction ( e.g. , process building, office building, camp, storage building, and maintenance garage):

Include capital expenditures on buildings such as office buildings, camps, warehouses, maintenance garages, workshops, and laboratories. Fixtures, facilities and equipment that are integral parts of the building are included.

D. Other construction assets ( e.g. , development drilling and completions, processing facilities, natural gas plants, upgraders):

Include all infrastructure, other than buildings, such as the cost of well pads, extraction and processing infrastructure and plants, upgrading units, transportation infrastructure, water and sewage infrastructure, tailings, pipelines and wellhead production facilities (pumpjacks, separators, etc. ). Include all preconstruction planning and design costs such as development drilling, regulatory approvals, environmental assessments, engineering and consulting fees and any materials supplied to construction contractors for installation, as well as site clearance and preparation. Equipment which is installed as an integral or built-in feature of a fixed structure ( e.g. , casings, tanks, steam generators, pumps, electrical apparatus, separators, flow lines, etc. ) should be reported with the construction asset; however, when the equipment is replaced within an existing structure, the replacement cost should be reported in machinery and equipment (sustaining capital).

E. Machinery and equipment purchases ( e.g. , trucks, shovels, computers, etc. ):

Include transportation equipment for people and materials, computers, software, communication equipment, and processing equipment not included in the above categories.

Intentions 2027

 Intentions 2027 ( CAN$ '000 )
Oil and gas rights acquisitions and retention costs 
Exploration and evaluation 
Non-residential building construction 
Development and other construction 
Machinery and equipment 
Total 

Total

7.  You have not reported any capital expenditure intentions for 2027.

Please indicate the reason.

  • Zero capital expenditure intentions for 2027
  • Figures not available but plans are for no change in capital expenditures for 2027
  • Figures not available but plans are for an increase in capital expenditures for 2027
  • Figures not available but plans are for a decrease in capital expenditures for 2027

Research and Development

8. For the 2027 fiscal year, does this organization plan on performing scientific research and development in Canada of at least $10,000 or outsourcing (contracting-out) to another organization scientific research and development activities of at least $10,000?

Research and experimental development (R&D) comprise creative and systematic work undertaken in order to increase the stock of knowledge - including knowledge of humankind, culture and society - and to devise new applications of available knowledge. For an activity to be an R&D activity, it must satisfy five core criteria:

  1. To be aimed at new findings (novel);
  2. To be based on original, not obvious, concepts and hypothesis (creative);
  3. To be uncertain about the final outcome (uncertainty);
  4. To be planned and budgeted (systematic);
  5. To lead to results to could be possibly reproduced (transferable/ or reproducible).

The term R&D covers three types of activity: basic research, applied research and experimental development. Basic research is experimental or theoretical work undertaken primarily to acquire new knowledge of the underlying foundations of phenomena and observable facts, without any particular application or use in view. Applied research is original investigation undertaken in order to acquire new knowledge. It is, however, directed primarily towards a specific, practical aim or objective. Experimental development is systematic work, drawing on knowledge gained from research and practical experience and producing additional knowledge, which is directed to producing new products or processes or to improving existing products or processes.

  • Yes
  • No

Notification of intent to extract web data

9. Does this business have a website?

Statistics Canada engages in web-data extraction, also known as web scraping, which is a process by which information is gathered and copied from the Web using automated scripts or robots, for retrieval and analysis. As a result, we may visit the website for this organization to search for and compile additional information. The use of web scraping is part of a broader effort to reduce the response burden on organizations, as well as produce additional statistical indicators to ensure that our data remain accurate and relevant.

We will strive to ensure that the data collection does not interfere with the functionality of the website. Any data collected will be used by Statistics Canada for statistical and research purposes only, in accordance with the agency’s privacy and confidentiality mandate.

More information regarding Statistics Canada’s web scraping initiative- this link will open in a new window.

Learn more about Statistics Canada’s transparency and accountability- this link will open in a new window.

If you have any questions or concerns, please contact Statistics Canada Client Services, toll-free at 1-877-949-9492 [Teletypewriter or Telecommunication device for the deaf/teletype machine (TTY): 1-800-363-7629] or by email at infostats@statcan.gc.ca - this link will open in a new window. Additional information about this survey can be found by selecting the following link: Annual Capital Expenditures Survey: Preliminary Estimate for 2026 and Intentions for 2027.

Changes or events

10. Indicate any changes or events that affected the reported values for this business or organization, compared with the last reporting period.

Select all that apply.

  • Labour shortages or employee absences
  • Disruptions in supply chains
  • Deferred plans to future or projects on hold
  • Strike or lock-out
  • Exchange rate impact
  • Price changes in goods or services sold
  • Contracting out
  • Organizational change
  • Price changes in labour or raw materials
  • Natural disaster
  • Recession
  • Change in product line
  • Sold business or business units
  • Expansion
  • New or lost contract
  • Plant closures
  • Acquisition of business or business units
  • Other
    Specify the other changes or events:
  • No changes or events

Contact person

11. Statistics Canada may need to contact the person who completed this questionnaire for further information.

Is [Provided Given Names], [Provided Family Name] the best person to contact?

  • Yes
  • No

Who is the best person to contact about this questionnaire?
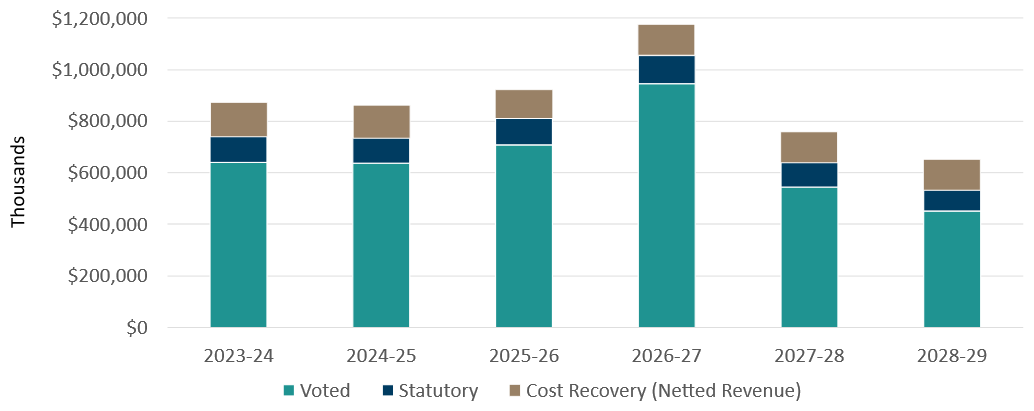
First name:

Last name:

Title:

Email address:
Example: user@example.gov.ca

Telephone number (including area code):
Example: 123-123-1234

Extension number (if applicable):
The maximum number of characters is 5.

Fax number (including area code):
Example: 123-123-1234

Feedback

12. How long did it take to complete this questionnaire?

Include the time spent gathering the necessary information.

  • Hours:
  • Minutes:

13. Do you have any comments about this questionnaire?